Difference between revisions of "IS428 AY2018-19T1 Chrysta Yuen Jia Lin"
| Line 91: | Line 91: | ||
|} | |} | ||
| + | =Conclusion= | ||
=Reference= | =Reference= | ||
| + | |||
| + | =Feedback= | ||
Revision as of 05:19, 11 November 2018
Contents
Problem and Motivation
Air pollution is an important risk factor for health in Europe and worldwide. A recent review of the global burden of disease showed that it is one of the top ten risk factors for health globally. Worldwide, an estimated 7 million people died prematurely because of pollution; in the European Union (EU) 400,000 people suffer a premature death. The Organisation for Economic Cooperation and Development (OECD) predicts that in 2050 outdoor air pollution will be the top cause of environmentally related deaths worldwide. In addition, air pollution has also been classified as the leading environmental cause of cancer.
In particular, air quality in Bulgaria is a big concern: measurements show that citizens all over the country breathe in air that is considered harmful to health. For example, concentrations of PM2.5 and PM10 are much higher than what the EU and the World Health Organization (WHO) have set to protect health. Bulgaria had the highest PM2.5 concentrations of all EU-28 member states in urban areas over a three-year average. For PM10, Bulgaria is also leading on the top polluted countries with 77 μg/m3on the daily mean concentration (EU limit value is 50 μg/m3).
According to the WHO, 60 percent of the urban population in Bulgaria is exposed to dangerous (unhealthy) levels of particulate matter (PM10).
With the huge amount of data collected, there is a need to build an interactive data visualization tool to assist the WHO and the government officials in Bulgaria to identify the areas with highly polluted air that is unfit for breathing.
Dataset Analysis & Transformation Process
Before analyzing the data, there is a need to do data preparation to make sense of the data. Under the Sofia Air data, there are 4 different zip files provided in the assignment with each own unique ways to process and make sense of the data. This particular section will be used to elaborate on the dataset analysis and its transformation process for each dataset, to prepare the data for import and analysis onto tableau.
EEA Data
Task 1: Spatio-temporal Analysis of Official Air Quality
| What does a typical day look like for Sofia city? |
|---|
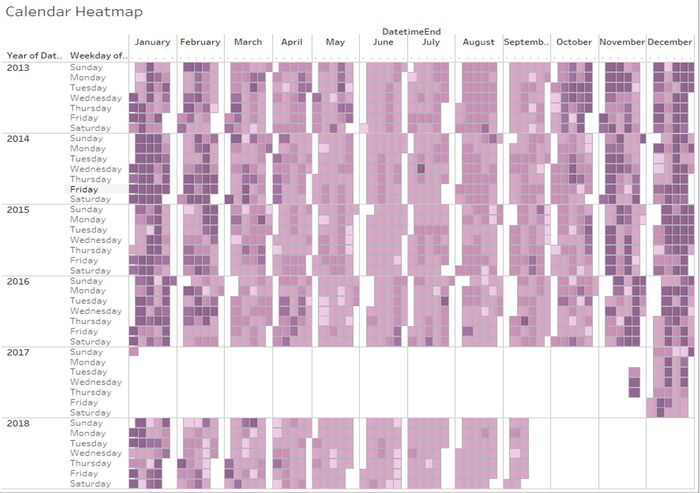
| A typical day in Sofia city can be seen from the image in Figure 1.
The concentration level is divided into 5 different concentration bins:
A typical day in Sofia city from March to October is generally rated “Fair”; where a Fair grade is determine by a concentration level between 30-45um/g. However, a typical day in Sofia city from November to February is generally rated “Very Poor”; where a Very Poor grade is determine by a concentration level that is higher than 60. |
| Do you see any trends of possible interest in this investigation? |
| What anomalies do you find in the official air quality dataset? |
| How do these affect your analysis of potential problems to the environment? |
Task 2: Spatio-temporal Analysis of Citizen Science Air Quality Measurements
| Characterize the sensors’ coverage, performance and operation. Are they well distributed over the entire city? |
|---|
| Are they all working properly at all times? |
| Can you detect any unexpected behaviors of the sensors through analyzing the readings they capture? |
| Which part of the city shows relatively higher readings than others? |
| Are these differences time dependent? |
Task 3
| Context |
|---|
Urban air pollution is a complex issue. There are many factors affecting the air quality of a city. Some of the possible causes are:
|
| Reveal the relationships between the factors mentioned above and the air quality measure detected in Task 1 and Task 2. |

