Difference between revisions of "IS428 AY2018-19T1 Ahmad Saifullah Bin Mustaffa"
Ahmadsm.2015 (talk | contribs) |
Ahmadsm.2015 (talk | contribs) |
||
| Line 29: | Line 29: | ||
| | | | ||
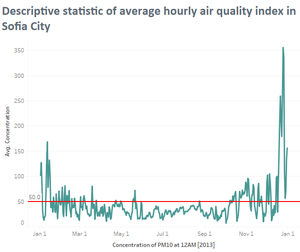
[[File:2013.png|thumb|center]] | [[File:2013.png|thumb|center]] | ||
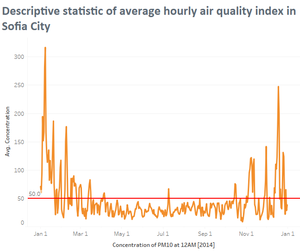
| + | [[File:2014.png|thumb|center]] | ||
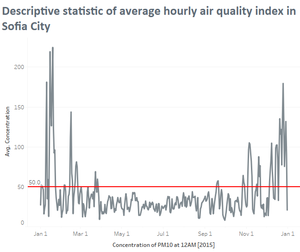
| + | [[File:2015.png|thumb|center]] | ||
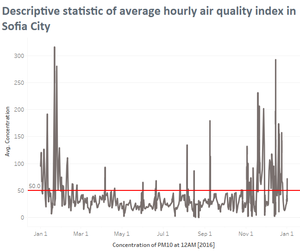
| + | [[File:2016.png|thumb|center]] | ||
| + | <br> | ||
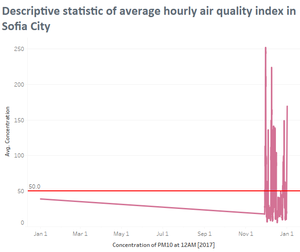
| + | [[File:2017.png|thumb|center]] | ||
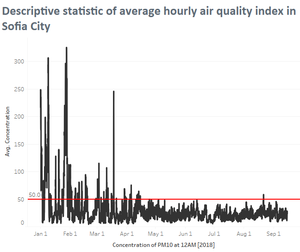
| + | [[File:2018.png|thumb|center]] | ||
| + | <br> | ||
| + | |||
|- | |- | ||
| <b>Interactive Technique</b><br> | | <b>Interactive Technique</b><br> | ||
Revision as of 17:20, 10 November 2018
To be a Visual Detective
Contents
Overview
Air pollution is an important risk factor for health in Europe and worldwide. A recent review of the global burden of disease showed that it is one of the top ten risk factors for health globally. Worldwide an estimated 7 million people died prematurely because of pollution; in the European Union (EU) 400,000 people suffer a premature death. The Organisation for Economic Cooperation and Development (OECD) predicts that in 2050 outdoor air pollution will be the top cause of environmentally related deaths worldwide. In addition, air pollution has also been classified as the leading environmental cause of cancer.
Air quality in Bulgaria is a big concern: measurements show that citizens all over the country breathe in air that is considered harmful to health. For example, concentrations of PM2.5 and PM10 are much higher than what the EU and the World Health Organization (WHO) have set to protect health.
Bulgaria had the highest PM2.5 concentrations of all EU-28 member states in urban areas over a three-year average. For PM10, Bulgaria is also leading on the top polluted countries with 77 μg/m3on the daily mean concentration (EU limit value is 50 μg/m3).
According to the WHO, 60 percent of the urban population in Bulgaria is exposed to dangerous (unhealthy) levels of particulate matter (PM10).
Dataset Analysis & Transformation Process
| Problem #1 | Building Data |
|---|---|
| Issue | The official air quality measurement readings (EEA data) do not include the longitude and latitude of the place of measurement. Instead, they are contained in a separate metadata file. |
| Solution | Append all the files together, followed by a left join with the metadata file. This is to assign the respective longitude and latitudes to the all the rows, based on their respective Air Quality Stations. |
Task 1
| Spatio-temporal Analysis of Official Air Quality |
|---|
|
|
Interactive Technique
|
