Difference between revisions of "UIUX: Proposal"
Jump to navigation
Jump to search
Feel free to comment on our project! 😁
| Line 29: | Line 29: | ||
<center><div style="background:#FF6A00; padding: 15px; line-height: 0.3em; letter-spacing:0.5em;font-size:20px"><font color=#fbfcfd face="Agency FB">DATA SOURCES</font></div></center> | <center><div style="background:#FF6A00; padding: 15px; line-height: 0.3em; letter-spacing:0.5em;font-size:20px"><font color=#fbfcfd face="Agency FB">DATA SOURCES</font></div></center> | ||
| + | {| class="wikitable" width="100%" | ||
| + | |- | ||
| + | ! style="font-weight: bold;background:#F8F9FA;color:#000000;width: 40%;" | Data Set | ||
| + | ! style="font-weight: bold;background:#F8F9FA;color:#000000;width: 25%" | Data Attributes | ||
| + | ! style="font-weight: bold;background:#F8F9FA;color:#000000;width: 35%" | Purpose | ||
| + | |- | ||
| + | | <center>M450081 - Merchandise Imports By Country/Region, Monthly | ||
| + | http://www.tablebuilder.singstat.gov.sg/publicfacing/createDataTable.action?refId=15544</center> | ||
| + | || | ||
| + | *FY Jan 1976 - Aug 2018 | ||
| + | *119 Countries (inclusive of grouping by 6 Continents) | ||
| + | |||
| + | ||To understand the import figures distributed across all countries as well as grouped by continents. | ||
| + | |- | ||
| + | |||
| + | |- | ||
| + | | <center>M450081 - Merchandise Exports By Country/Region, Monthly http://www.tablebuilder.singstat.gov.sg/publicfacing/createDataTable.action?refId=15337/ </center> | ||
| + | |||
| + | || | ||
| + | *FY Jan 1976 - Aug 2018 | ||
| + | *119 Countries (inclusive of grouping by 6 Continents) | ||
| + | |||
| + | ||To understand the export figures distributed across all countries as well as grouped by continents. | ||
| + | |- | ||
| + | |||
| + | |- | ||
| + | | <center>M060251 - Trade In Services By Services Category, Annual | ||
| + | http://www.tablebuilder.singstat.gov.sg/publicfacing/createDataTable.action?refId=12396</center> | ||
| + | |||
| + | || | ||
| + | *Total Trade In Services | ||
| + | *Export of Services / Import of Services | ||
| + | |||
| + | || | ||
| + | To identify trends and understand the distribution of services by category for both imports and exports. | ||
| + | |- | ||
| + | |||
| + | |||
| + | |} | ||
<center><div style="background:#FF6A00; padding: 15px; line-height: 0.3em; letter-spacing:0.5em;font-size:20px"><font color=#fbfcfd face="Agency FB">VISUALISATION PLAN</font></div></center> | <center><div style="background:#FF6A00; padding: 15px; line-height: 0.3em; letter-spacing:0.5em;font-size:20px"><font color=#fbfcfd face="Agency FB">VISUALISATION PLAN</font></div></center> | ||
Revision as of 18:22, 14 October 2018
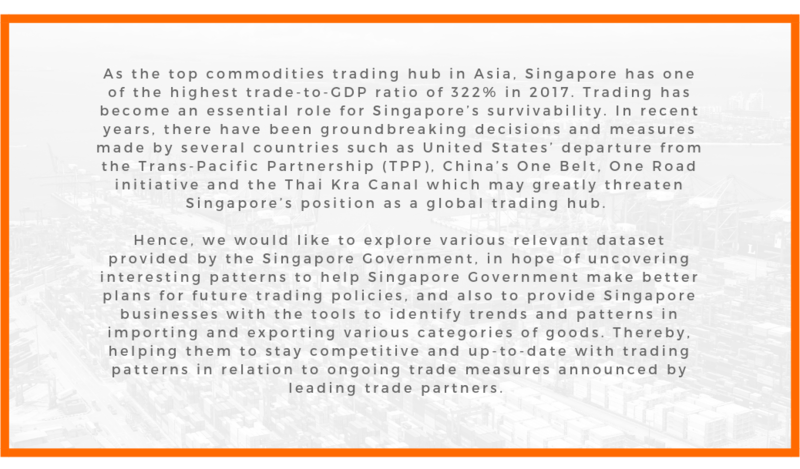
PROBLEM & MOTIVATION
DATA SOURCES
| Data Set | Data Attributes | Purpose |
|---|---|---|
|
To understand the import figures distributed across all countries as well as grouped by continents. | |
|
To understand the export figures distributed across all countries as well as grouped by continents. | |
|
To identify trends and understand the distribution of services by category for both imports and exports. |
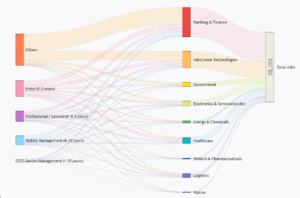
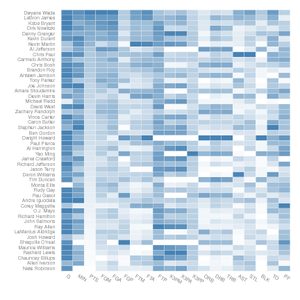
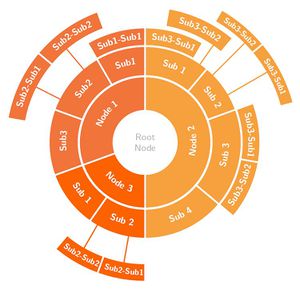
VISUALISATION PLAN
Type of Visualization |
Detailed Description
|
|---|---|
Sample link: http://bl.ocks.org/d3noob/5028304 |
|
Sample link: http://bl.ocks.org/josiahdavis/7e488547a6381a365ac9 |
|
Sample link: https://beta.observablehq.com/@mbostock/d3-sunburst |
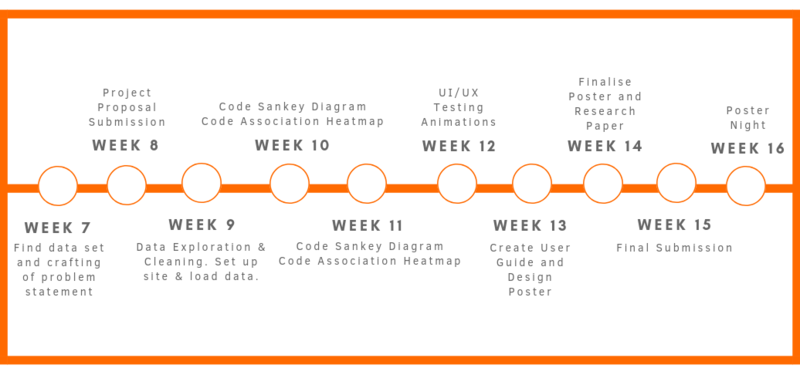
PROJECT TIMELINE
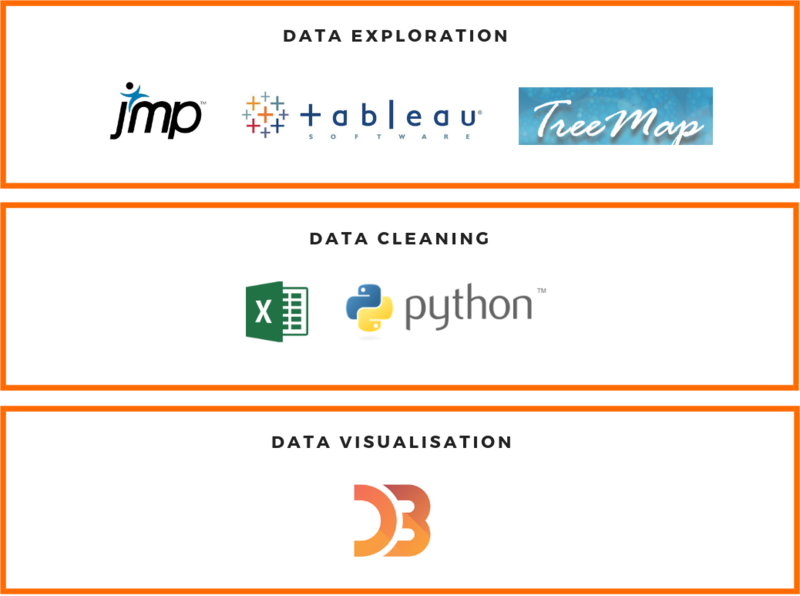
TECHNOLOGIES
TECHNICAL CHALLENGES
| Challenges | Mitigation Plan |
|---|---|
|
|
|
|
|
|
COMMENTS
Feel free to comment on our project! 😁

