Difference between revisions of "Unicorn Ventures"
Yu.fu.2015 (talk | contribs) |
Yu.fu.2015 (talk | contribs) |
||
| (24 intermediate revisions by the same user not shown) | |||
| Line 2: | Line 2: | ||
<br> | <br> | ||
<!--MAIN HEADER --> | <!--MAIN HEADER --> | ||
| − | {|style="background-color:# | + | {|style="background-color:#FF5A60;" width="100%" cellspacing="0" cellpadding="0" valign="top" border="0" | |
| − | | style="font-family:Century Gothic; font-size:85%; solid #f48024 ; border-bottom:0px solid # | + | | style="font-family:Century Gothic; font-size:85%; solid #f48024 ; border-bottom:0px solid #FF5A60 ; background:#FF5A60 ; text-align:center;" width="16.6%" | |
[[Project_Groups | <font color="#fff">PROJECT GROUP</font>]] | [[Project_Groups | <font color="#fff">PROJECT GROUP</font>]] | ||
| | | | ||
| − | | style="font-family:Century Gothic; font-size:85%; solid #f48024 ; border-bottom:0px solid # | + | | style="font-family:Century Gothic; font-size:85%; solid #f48024 ; border-bottom:0px solid #FF5A60 ; background:#FF5A60 ; text-align:center;" width="16.6%" | |
| − | [[ | + | [[IS428 2018-19 T1 Group 03 Unicorn Ventures: Team| <font color="#fff">TEAM</font>]] |
| | | | ||
| − | | style="font-family:Century Gothic; font-size:85%; solid #f48024 ; border-bottom:0px solid # | + | | style="font-family:Century Gothic; font-size:85%; solid #f48024 ; border-bottom:0px solid #FF5A60 ; background:#252320; text-align:center;" width="16.6%" | |
| − | [[ | + | [[IS428 2018-19 T1 Group 03 Unicorn Ventures: Proposal | <font color="#FFF">PROPOSAL</font>]] |
| | | | ||
| − | | style="font-family:Century Gothic; font-size:85%; solid | + | | style="font-family:Century Gothic; font-size:85%; solid FF5A60 ; border:0px solid #FF5A60 background:#FF5A60; background:#FF5A60; text-align:center;" width="16.6%" | |
| − | [[ | + | [[IS428 2018-19 T1 Group 03 Unicorn Ventures: Poster | <font color="#fff">POSTER</font>]] |
| | | | ||
| − | | style="font-family:Century Gothic; font-size:85%; solid #f48024 ; border:0px solid # | + | | style="font-family:Century Gothic; font-size:85%; solid #f48024 ; border:0px solid #FF5A60 background:#FF5A60; background:#FF5A60; text-align:center;" width="16.6%" | |
| − | [https:// | + | [https://is428-ay2018-2019-unicorn-ventures.shinyapps.io/application/ <font color="#FFFFFF">APPLICATION</font>] |
| | | | ||
| − | | style="font-family:Century Gothic; font-size:85%; solid #f48024 ; border:0px solid # | + | | style="font-family:Century Gothic; font-size:85%; solid #f48024 ; border:0px solid #FF5A60 background:#FF5A60; background:#FF5A60; text-align:center;" width="16.6%" | |
| − | [[IS428 | + | [[IS428 2018-19 T1 Group 03 Unicorn Ventures: Report | <font color="#FFFFFF">RESEARCH PAPER</font>]] |
| | | | ||
|} | |} | ||
| − | [[ | + | [[IS428 2018-19 T1 Group 03 Unicorn Ventures: Proposal Version 1 | <font color="#000">Version 1</font>]] | [[IS428 2018-19 T1 Group 03 Unicorn Ventures: Proposal | <font color="#000">'''Version 2'''</font>]] |
<br> | <br> | ||
<div style="margin-top:10px"> | <div style="margin-top:10px"> | ||
| − | <div style="background: #FF7F50 ; margin-top: 40px; font-weight: bold; line-height: 0.3em;letter-spacing:-0.08em;font-size:20px"><font color=# | + | <div style="background: #FF7F50 ; margin-top: 40px; font-weight: bold; line-height: 0.3em;letter-spacing:-0.08em;font-size:20px"><font color=#FF5A60 face="Century Gothic">INTRODUCTION</font></div> |
<br/> | <br/> | ||
| − | Blockchain, artificial intelligence, data science, edtech and internet-of-things are all buzzwords today in this new innovation era. More and more founders and investors begin to see the potential of innovation in Asia today. Meanwhile, local governments in the region have introduced new policies and initiatives to explore new technological innovation frontiers in order to boost the competitiveness of various knowledge-based industries. | + | Blockchain, artificial intelligence, data science, edtech and internet-of-things are all buzzwords today in this new innovation era. More and more founders and investors begin to see the potential of innovation in Asia today. Meanwhile, local governments in the region have introduced new policies and initiatives to explore new technological innovation frontiers in order to boost the competitiveness of various knowledge-based industries. [https://www.cnbc.com/2018/04/10/singapore-and-hong-kong-are-winning-over-start-up-accelerators.html In recent years, both Hong Kong and Singapore government has pumped in resources] including start-up clusters, grants and funding to boost its start-up Ecosystem. |
| − | |||
The two Asian-Tigers, Singapore and Hong Kong, will be the main contexts for this project. They are two high-growth metropolitan city-states in Asia that share many characteristics in common in terms of GDP per capita and population density. Beyond that, both Hong Kong and Singapore offers a comprehensive financial and technical infrastructure and has attracted a considerable amount of foreign investment. It is commendable that both countries have achieved stellar economic performance despite the lack of natural resources and large land size. Unicorn Ventures strives to study the current start-up ecosystem in these two city-based regions and hope to generate new insights for policy-makers, founders and investors. | The two Asian-Tigers, Singapore and Hong Kong, will be the main contexts for this project. They are two high-growth metropolitan city-states in Asia that share many characteristics in common in terms of GDP per capita and population density. Beyond that, both Hong Kong and Singapore offers a comprehensive financial and technical infrastructure and has attracted a considerable amount of foreign investment. It is commendable that both countries have achieved stellar economic performance despite the lack of natural resources and large land size. Unicorn Ventures strives to study the current start-up ecosystem in these two city-based regions and hope to generate new insights for policy-makers, founders and investors. | ||
</div> | </div> | ||
| − | <div style="background: #FF7F50 ; margin-top: 40px; font-weight: bold; line-height: 0.3em;letter-spacing:-0.08em;font-size:20px"><font color=# | + | <div style="background: #FF7F50 ; margin-top: 40px; font-weight: bold; line-height: 0.3em;letter-spacing:-0.08em;font-size:20px"><font color=#FF5A60 face="Century Gothic">MOTIVATION</font></div> |
<br /> | <br /> | ||
| − | + | As there is a general lack of effective and user-friendly visualization for discovering country-specific differences between the start-up ecosystems, the main motivation behind this project is to create a centralized, dynamic and interactive dashboard for quantitative comparisons on various aspects of start-ups and funding organizations in Singapore and Hong Kong. Based on User-Centric Dashboard Design Guide, this dashboard takes a broad, strategic, customizable, drillable and exploratory approach and is targeted at potential entrepreneurs, policy makers and investors. | |
| + | This project will focus on start-up companies and funding organizations in the tech ecosystem. The insights generated could help: | ||
| + | *Enable potential entrepreneurs to understand the growing and declining industries, investors’ profile as well as pinpoint the top funded start-ups | ||
| + | *Help policy makers to identify the potential profitable and leading industries and dedicate more resources in specific industries | ||
| + | *Assist investors in identifying the difference between Singapore and Hong Kong’s start-up industries and strategizing future investments in these two regions | ||
| − | |||
| − | |||
<br /> | <br /> | ||
| − | <div style="background: #FF7F50 ; margin-top: 40px; font-weight: bold; line-height: 0.3em;letter-spacing:-0.08em;font-size:20px"><font color=# | + | <div style="background: #FF7F50 ; margin-top: 40px; font-weight: bold; line-height: 0.3em;letter-spacing:-0.08em;font-size:20px"><font color=#FF5A60 face="Century Gothic">OBJECTIVES</font></div> |
<br> | <br> | ||
| − | Our project aims to explore and compare the following aspects for the | + | Our project aims to explore and compare the following aspects for the start-up ecosystem in Singapore and Hong Kong by considering the start-ups founded after 2000. We hope to address the following questions |
| − | ecosystem in Singapore and Hong Kong by considering the | + | For Entrepreneurs: |
| − | 2000. | + | *Time-series analysis: When was the start-ups founded, exited and funded? |
| + | *Funding Analysis: Discovering the top funded start-ups | ||
| + | *Spatial Analysis: Where do the investors originate from? | ||
| + | For Policy Makers/Investors: | ||
| + | *Profile Analysis: What are the differences in terms of start-up formation across the years? | ||
| + | *Industry Analysis: Comparing the start-ups in various industries and sectors based on different performance indicators | ||
| − | |||
| − | |||
| − | |||
| − | |||
| − | |||
| − | |||
| − | |||
| − | |||
| − | |||
</br> | </br> | ||
| − | <div style="background: #FF7F50 ; margin-top: 40px; font-weight: bold; line-height: 0.3em;letter-spacing:-0.08em;font-size:20px"><font color=# | + | <div style="background: #FF7F50 ; margin-top: 40px; font-weight: bold; line-height: 0.3em;letter-spacing:-0.08em;font-size:20px"><font color=#FF5A60 face="Century Gothic">SELECTED DATASET</font></div> |
{| class="wikitable" style="background-color:#FFFFFF;" width="100%" | {| class="wikitable" style="background-color:#FFFFFF;" width="100%" | ||
| − | ! Dataset | + | ! Dataset |
| − | |||
|- | |- | ||
| + | |||
| | | | ||
| − | <p><center>''' | + | <p><center>'''Basic Startup Information in Singapore and Hong Kong''' </center></p> |
| − | *Description: | + | *Description: This dataset includes various key attributes on startups in Singapore and Hong Kong that was founded after 2000. |
| − | *Source: | + | *Source: [https://www.crunchbase.com/search/organization.companies/a7600f0093365b7c1eb51e6325036762f5a19635 Crunchbase] |
| − | + | *[https://drive.google.com/open?id=1y0lhzu9b1CD4hRvORNhakkraBorUBmiX Dataset] | |
| − | https:// | + | *Components: |
| + | |||
| + | {| class="wikitable" style="background-color:#FFFFFF;" width="100%" | ||
| + | |||
| + | ! Field | ||
| + | ! Type | ||
| + | ! Description | ||
| + | |- | ||
| + | | style="text-align: center;" | Organization Name | ||
| + | |||
| + | |String | ||
| + | |||
| + | |Organization Name | ||
| + | |- | ||
| + | |- | ||
| + | | style="text-align: center;" | Categories | ||
| + | |String | ||
| + | |Industry the organization belongs to | ||
| + | |- | ||
| + | |- | ||
| + | | style="text-align: center;" | Sub Category 1 | ||
| + | |String | ||
| + | |Sub category the organization belongs to | ||
| + | |- | ||
| + | |- | ||
| + | | style="text-align: center;" | Sub Category 1 | ||
| + | |String | ||
| + | |Sub category the organization belongs to | ||
| + | |- | ||
| + | |- | ||
| + | | style="text-align: center;" | Headquarter Location | ||
| + | |String | ||
| + | |Organization headquarter location | ||
| + | |- | ||
| + | |- | ||
| + | | style="text-align: center;" | Description | ||
| + | |String | ||
| + | |Organization description | ||
| + | |- | ||
| + | |- | ||
| + | | style="text-align: center;" | Founded_Date | ||
| + | |String | ||
| + | |Organization founding date | ||
| + | |- | ||
| + | |- | ||
| + | | style="text-align: center;" | Exit Date | ||
| + | |String | ||
| + | |Organization exit date | ||
| + | |- | ||
| + | |- | ||
| + | | style="text-align: center;" | Last Funding Date | ||
| + | |Date | ||
| + | |Last Funding Date | ||
| + | |- | ||
| + | |- | ||
| + | | style="text-align: center;" | Last Funding Type | ||
| + | |String | ||
| + | |Last Funding Type | ||
| + | |- | ||
| + | |- | ||
| + | | style="text-align: center;" | Last Funding Amount Currency (in USD) | ||
| + | |String | ||
| + | |Last Funding Amount in USD | ||
| + | |- | ||
| + | |- | ||
| + | | style="text-align: center;" | Total Funding Amount Currency in USD | ||
| + | |String | ||
| + | |Total Funding Amount in USD | ||
| + | |- | ||
| + | |} | ||
| + | |- | ||
| | | | ||
| + | <p><center>'''Investment and Funding Information in Singapore and Hong Kong ''' </center></p> | ||
| + | *Description: This dataset details the individual disclosed funding transactions that are public and are published in crunchbase. | ||
| + | *Source: [https://www.crunchbase.com/search/funding_rounds/635cbd9bcafca178f043955a5ddebe9b5603acaa Crunchbase] | ||
| + | *[https://drive.google.com/open?id=1XTr_kgsya8LDM4GjuM1S7k4vGAmfSVeg Dataset] | ||
| + | *Components: | ||
| + | |||
{| class="wikitable" style="background-color:#FFFFFF;" width="100%" | {| class="wikitable" style="background-color:#FFFFFF;" width="100%" | ||
| − | ! | + | ! Field |
| − | ! | + | ! Type |
| + | ! Description | ||
|- | |- | ||
| − | | style="text-align: center;" | | + | | style="text-align: center;" | Transaction Name |
| + | |||
| + | |String | ||
| − | | | + | |Auto-generated name of transaction (e.g. Angel-Uber) |
| − | |||
| − | |||
| − | |||
| − | |||
| − | |||
|- | |- | ||
|- | |- | ||
| − | | style="text-align: center;" | | + | | style="text-align: center;" | Organization Name |
| + | |||
| + | |String | ||
| − | | | + | |Name of the organization that got funded. |
| − | + | |- | |
| − | + | |- | |
| − | + | | style="text-align: center;" | Categories | |
| − | + | |String | |
| + | |Industry the organization belongs to | ||
| + | |- | ||
| + | |- | ||
| + | | style="text-align: center;" | Location | ||
| + | |String | ||
| + | |Location of the organization that got funded | ||
| + | |- | ||
| + | |- | ||
| + | | style="text-align: center;" | Funding Type | ||
| + | |String | ||
| + | |Type of Funding Round (e.g. Seed, Series A, Private Equity, Debt Financing) | ||
| + | |- | ||
| + | |- | ||
| + | | style="text-align: center;" | Money Raised Currency (in USD) | ||
| + | |Integer | ||
| + | |Amount of money raised in Funding Round | ||
| + | |- | ||
| + | |- | ||
| + | | style="text-align: center;" | Announced Date | ||
| + | |Date | ||
| + | |Date that the Funding Round was publicly anounced | ||
| + | |- | ||
|- | |- | ||
| + | | style="text-align: center;" | Funding Stage | ||
| + | |String | ||
| + | |The funding stage of a funding round | ||
|- | |- | ||
| − | |||
| + | |} | ||
| + | |- | ||
| | | | ||
| − | * | + | <p><center>'''Investor Information in Singapore and Hong Kong ''' </center></p> |
| − | * | + | *Description: This dataset shows the investor locations and number of investments made by the investors . |
| − | * | + | |
| − | * | + | *Source: [https://www.crunchbase.com/search/principal.investors/6803113d3482513cb2152ca68c002ad6501dd7c7 Crunchbase] |
| − | + | *[https://drive.google.com/open?id=1Cy7HH-1gCbh8CIQHYAjhFw1cBcT5IkHM Dataset] | |
| − | |- | + | *Components: |
| − | + | ||
| + | {| class="wikitable" style="background-color:#FFFFFF;" width="100%" | ||
| + | ! Field | ||
| + | ! Type | ||
| + | ! Description | ||
|- | |- | ||
| − | | style="text-align: center;" | | + | | style="text-align: center;" | Location |
| − | | | + | |String |
| + | |Investor locations | ||
|- | |- | ||
| − | | style="text-align: center;" | | + | |- |
| + | | style="text-align: center;" | Lat | ||
| − | | | + | |Double |
| + | |Latitude of the location | ||
| + | |- | ||
| + | |- | ||
| + | | style="text-align: center;" | Categories | ||
| + | |Double | ||
| + | |Longitude of the location | ||
| + | |- | ||
| + | |- | ||
| + | | style="text-align: center;" | Number_of_Investments | ||
| + | |Integer | ||
| + | |Number of investments made by investors from the location | ||
| + | |- | ||
| + | |} | ||
|- | |- | ||
| − | | | + | | |
| + | <p><center>'''Other Startup Information in Singapore and Hong Kong''' </center></p> | ||
| + | *Description: This dataset includes other attributes on startups in Singapore and Hong Kong that was founded after 2000. | ||
| + | *Source: [https://www.crunchbase.com/search/organization.companies/a7600f0093365b7c1eb51e6325036762f5a19635 Crunchbase] | ||
| + | *[https://drive.google.com/open?id=1sYx1lezHo9KyTFD5l6M8GPgE1nuPk001 Dataset] | ||
| + | *Components: | ||
| − | | | + | {| class="wikitable" style="background-color:#FFFFFF;" width="100%" |
| + | ! Field | ||
| + | ! Type | ||
| + | ! Description | ||
|- | |- | ||
| − | | style="text-align: center;" | | + | | style="text-align: center;" | Organization Name |
| − | | | + | |String |
| + | |Organization Name | ||
| + | |- | ||
| + | |- | ||
| + | | style="text-align: center;" | Categories | ||
| + | |String | ||
| + | |Industry the organization belongs to | ||
| + | |- | ||
| + | |- | ||
| + | | style="text-align: center;" | Sector | ||
| + | |String | ||
| + | |The sector the organization belongs to | ||
| + | |- | ||
| + | |- | ||
| + | | style="text-align: center;" | Headquarter Location | ||
| + | |String | ||
| + | |Organization headquarter location | ||
| + | |- | ||
| + | |- | ||
| + | | style="text-align: center;" | CB_Rank | ||
| + | |Integer | ||
| + | |Crunchbase Rank | ||
| + | |- | ||
| + | |- | ||
| + | | style="text-align: center;" | Age_days | ||
| + | |Integer | ||
| + | |Age of the organization measured in days | ||
| + | |- | ||
| + | |- | ||
| + | | style="text-align: center;" | SimilarWeb_Average_Visits | ||
| + | |Double | ||
| + | |Average visits to the organization website recorded by SimilarWeb | ||
| + | |- | ||
| + | |- | ||
| + | | style="text-align: center;" | SimilarWeb_Visit_Duration | ||
| + | |Integer | ||
| + | |Visit duration to the organization website recorded by SimilarWeb | ||
| + | |- | ||
| + | |- | ||
| + | | style="text-align: center;" | SimilarWeb_Global_Traffic_Rank | ||
| + | |Double | ||
| + | |Organization website traffic ranking among all the organization websites globally recorded by SimilarWeb | ||
| + | |- | ||
| + | |- | ||
| + | | style="text-align: center;" | BuiltWith_Active_Tech_Count | ||
| + | |Integer | ||
| + | |Count of active technology used recorded by BuiltWit | ||
| + | |- | ||
|- | |- | ||
| − | |||
| − | |||
|} | |} | ||
| − | |||
| − | + | |- | |
| − | + | |} | |
| − | + | <div style="background: #FF7F50 ; margin-top: 40px; font-weight: bold; line-height: 0.3em;letter-spacing:-0.08em;font-size:20px"><font color=#FF5A60 face="Century Gothic">BACKGROUND SURVEY OF RELATED WORKS</font></div> | |
| − | <div style="background: #FF7F50 ; margin-top: 40px; font-weight: bold; line-height: 0.3em;letter-spacing:-0.08em;font-size:20px"><font color=# | ||
{| class="wikitable" style="background-color:#FFFFFF;" width="100%" | {| class="wikitable" style="background-color:#FFFFFF;" width="100%" | ||
! style="width:50%" | Related Works | ! style="width:50%" | Related Works | ||
! What We Can Learn | ! What We Can Learn | ||
|- | |- | ||
| − | |||
| + | |[https://online.flowpaper.com/7c3c077c/GlobalStartupEcosystemReport2017v18/#page=19 <center>'''Heat Map''' </center>] | ||
| + | |||
| + | <b>[[File: Heatmap unicorn.PNG|center|400px]] </b> | ||
| | | | ||
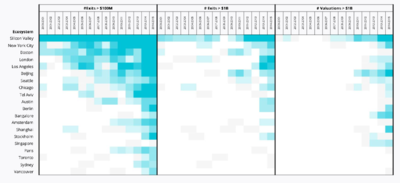
| + | *A heat map can display time series data for multiple dimensions across a fixed set of categories and this provides more information in one single chart. | ||
| + | *By looking at the overview of color intensity, user are able to identify the overall pattern of the data and highlight any exceptions/outliers. | ||
| + | *The color intensity displays the quantity while tooltip enables users to hover over the individual shaded area and understand the exact quantity. | ||
| + | |||
| + | |- | ||
| + | |[https://uc-r.github.io/cleveland-dot-plots <center>'''Cleveland Dot Plot''' </center>] | ||
| + | |||
| + | <b>[[File: Cleveland dot plot unicorn.PNG|center|400px]] </b> | ||
| + | |||
| + | | | ||
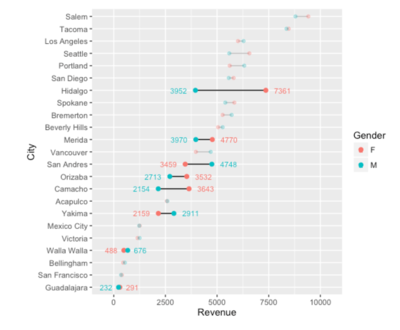
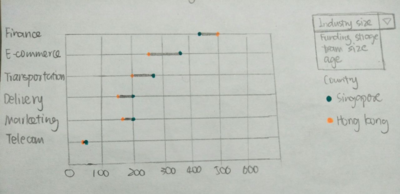
| + | *Cleveland Dot Plot is effective in comparing data of two parties on a single chart. It can easily communicate the huge gaps between two objects to the user. | ||
| + | *Unlike bar chart, this dot plot reduce the clutter and maximize the data-ink ratio. | ||
| + | |||
|- | |- | ||
| − | | | + | |[https://datavizcatalogue.com/methods/violin_plot.html <center>'''Violin Plot''' </center>] |
| + | |||
| + | <b>[[File:Violin plot 1.png|400px|center]]</b> | ||
| + | |||
| + | | | ||
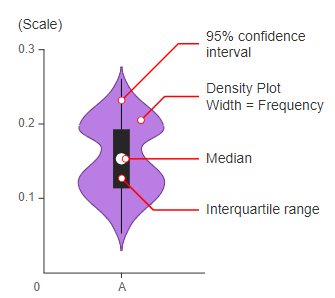
| + | A violin plot show more information in one plot: | ||
| + | * IQR (25% percentile, median, 75% percentile) and Max & Min | ||
| + | * 95% confidence interval | ||
| + | * Average | ||
| + | * Density plot indicating concentration of data | ||
| + | This can be used for our industry analysis to achieve a more insightful visualization | ||
| + | |- | ||
| + | |[https://clarity-us.com/data-viz-maps-hex-appeal/ <center>'''Dot Density Map''' </center>] | ||
| + | |||
| + | <b>[[File:Map-dot.png|400px|center]]</b> | ||
| | | | ||
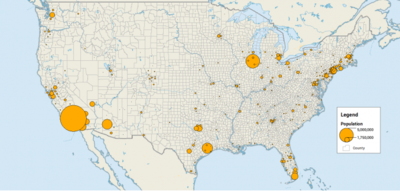
| + | * Dot Density Map is useful to show the value density in different locations. | ||
| + | * The color and size of the dot can represents different things. | ||
|- | |- | ||
|} | |} | ||
| − | <div style="background: #FF7F50 ; margin-top: 40px; font-weight: bold; line-height: 0.3em;letter-spacing:-0.08em;font-size:20px"><font color=# | + | <div style="background: #FF7F50 ; margin-top: 40px; font-weight: bold; line-height: 0.3em;letter-spacing:-0.08em;font-size:20px"><font color=#FF5A60 face="Century Gothic">SKETCHES STORYBOARD</font></div> |
{| class="wikitable" style="background-color:#FFFFFF;" width="100%" | {| class="wikitable" style="background-color:#FFFFFF;" width="100%" | ||
! style="width:50%" | Sketches | ! style="width:50%" | Sketches | ||
! How Analyst Can Conduct Analysis | ! How Analyst Can Conduct Analysis | ||
|- | |- | ||
| − | |||
| − | <b> </b> | + | | style="text-align: center;" | <b></b> |
| + | |||
| + | <b>[[File: Heatmap unicorn sketch.PNG|center|400px]] </b> | ||
| | | | ||
| + | Heat Map: | ||
| + | *Shows time-series analysis for startups that has formed or exited and their funding amount across the years according different industries | ||
| + | *AllowS the user to identify the growing industries as well as the trend in start-up formation and funding amount | ||
|- | |- | ||
| style="text-align: center;" | <b></b> | | style="text-align: center;" | <b></b> | ||
| − | <b></b> | + | <b>[[File: Cleveland dot plot unicorn sketch.PNG|center|400px]] </b> |
| + | |||
| + | | | ||
| + | Cleveland Dot Plot with Filters: | ||
| + | *Presents current breakdown of startups by industries | ||
| + | *Colour of the dots represent the region | ||
| + | |||
| + | |- | ||
| + | | style="text-align: center;" | <b></b> | ||
| + | |||
| + | <b>[[File:Violin-own-2.png|600px|center]]</b> | ||
| | | | ||
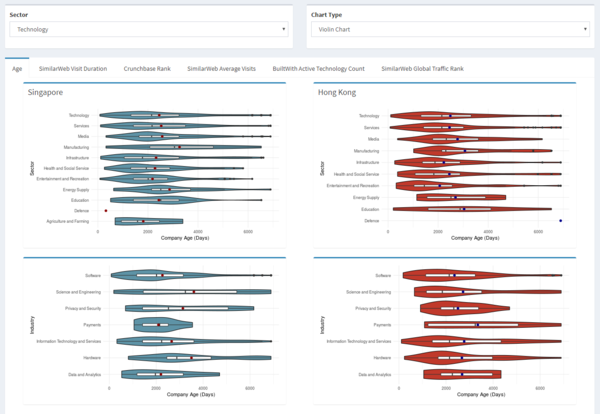
| + | Violin Plot with filters: | ||
| + | * Displays values across sectors and industry inside each sector across 2 regions. The values are: age (company age), similarweb visit duration, crunchbase rank, similarweb average visits, builtwith active technology count, global traffic rank. | ||
| + | * The value shown are accessible through tabs. | ||
| + | * Breakdown of industries in each sector is shown by selecting sector in dropdown list. | ||
| + | * User can choose bar chart over violin chart to have an overview of data. | ||
|- | |- | ||
| − | | | + | | style="text-align: center;" | <b></b> |
| − | |||
| − | |||
| − | < | + | <b> |
| − | + | [[File:Density-map.png|400px|center]] | |
| + | </b> | ||
| + | | | ||
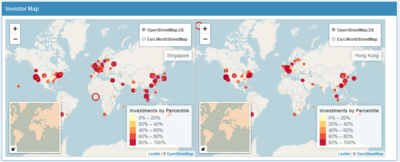
| + | Dot Density Map: | ||
| + | * color shows number of investments by percentile (to standardize the skewed number) | ||
| + | * size shows number of investments | ||
| + | * style of map can be changed using the radio button | ||
| + | |- | ||
| + | |} | ||
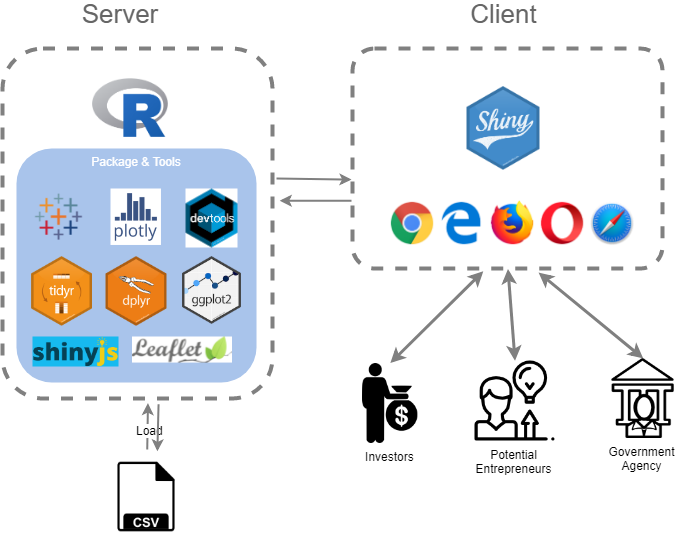
| + | <div style="background: #FF7F50 ; margin-top: 40px; font-weight: bold; line-height: 0.3em;letter-spacing:-0.08em;font-size:20px"><font color=#FF5A60 face="Century Gothic">ARCHITECTURE DIAGRAM</font></div> | ||
| − | < | + | <br>[[File:Technology diagram VA.png|center|700px]]</br> |
| + | <div style="background: #FF7F50 ; margin-top: 40px; font-weight: bold; line-height: 0.3em;letter-spacing:-0.08em;font-size:20px"><font color=#FF5A60 face="Century Gothic">KEY TECHNICAL CHALLENGES</font></div> | ||
| + | <br> | ||
| + | Domain Knowledge Understanding: | ||
| + | *As the datasets involves many technical terms in the startup ecosystem, the group has to study more in-depth on the terminologies used in the ecosystem in order to draw meaningful insights. This includes the definition of different funding stages, types of fundings, types of investors, startup industries categories and etc. | ||
| + | Data Preprocessing: | ||
| + | *Missing data: how to deal with missing values | ||
| + | *Data integration and calculation: understanding the column attributes and perform meaningful summation or calculation | ||
| + | *Multiple values for certain observations: how to deal with such attributes and ensure that the visualizations take into account of start-ups that has attributes with multiple values | ||
| + | Technological Expertise: | ||
| + | *Learning relevant packages under R such as ggplot2, tidyverse, shiny and plotly | ||
| + | *Learning how to integrate D3.js with R to achieve both advanced analytics functions as well as interactive visualization | ||
| + | *Learning integration of different charts and enhance the interactivity and animation techniques of the storyboard | ||
| + | </br> | ||
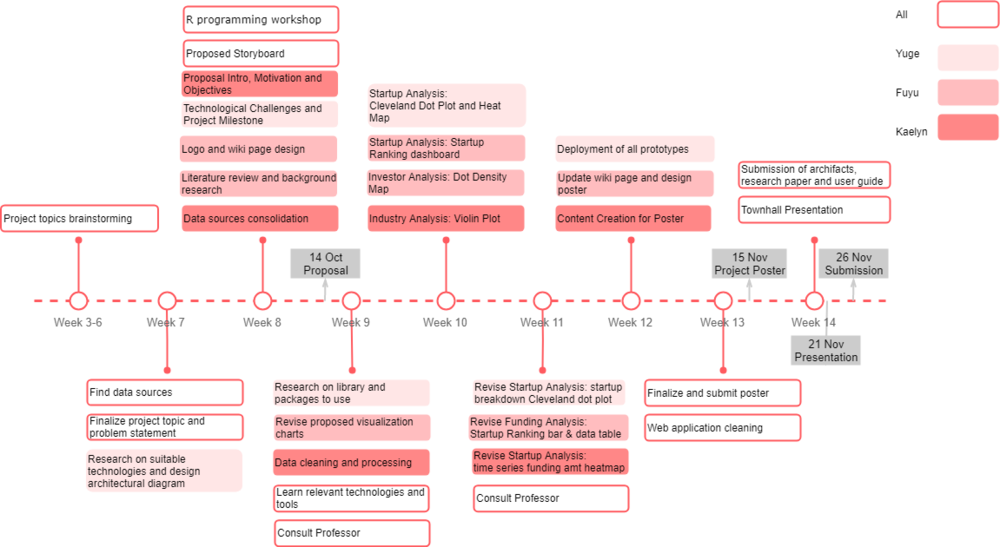
| + | <div style="background: #FF7F50 ; margin-bottom:10px; margin-top: 40px; font-weight: bold; line-height: 0.3em;letter-spacing:-0.08em;font-size:20px"><font color=#FF5A60 face="Century Gothic">PROJECT TIMELINE</font></div> | ||
| − | < | + | <br>[[File:Timeline Diagram.png|1000px|center]]</br> |
| + | <div style="background: #FF7F50 ; margin-top: 40px; font-weight: bold; line-height: 0.3em;letter-spacing:-0.08em;font-size:20px"><font color=#FF5A60 face="Century Gothic">REFERENCES</font></div> | ||
| + | <br> | ||
| + | *[https://online.flowpaper.com/7c3c077c/GlobalStartupEcosystemReport2017v18/#page=19 Global Startup Ecosystem Report 2017] | ||
| + | *[https://uc-r.github.io/cleveland-dot-plots UC Business Analytics R Programming Guide on Cleaveland Dot Plot] | ||
| + | *[https://datavizcatalogue.com/methods/violin_plot.html Data Visualisation Catalogue on Violin Plot] | ||
| + | *[https://clarity-us.com/data-viz-maps-hex-appeal/ Data Viz: Give Your Maps Some Hex Appeal] | ||
| + | *[https://www.crunchbase.com/ Crunchbase] | ||
| + | </br> | ||
| − | <div style="background: #FF7F50 ; margin-top: 40px; font-weight: bold; line-height: 0.3em;letter-spacing:-0.08em;font-size:20px"><font color=# | + | <div style="background: #FF7F50 ; margin-top: 40px; font-weight: bold; line-height: 0.3em;letter-spacing:-0.08em;font-size:20px"><font color=#FF5A60 face="Century Gothic">COMMENTS</font></div> |
Feel free to comments, suggestions and feedbacks to help us improve our project!:D | Feel free to comments, suggestions and feedbacks to help us improve our project!:D | ||
Latest revision as of 23:59, 25 November 2018
Blockchain, artificial intelligence, data science, edtech and internet-of-things are all buzzwords today in this new innovation era. More and more founders and investors begin to see the potential of innovation in Asia today. Meanwhile, local governments in the region have introduced new policies and initiatives to explore new technological innovation frontiers in order to boost the competitiveness of various knowledge-based industries. In recent years, both Hong Kong and Singapore government has pumped in resources including start-up clusters, grants and funding to boost its start-up Ecosystem.
The two Asian-Tigers, Singapore and Hong Kong, will be the main contexts for this project. They are two high-growth metropolitan city-states in Asia that share many characteristics in common in terms of GDP per capita and population density. Beyond that, both Hong Kong and Singapore offers a comprehensive financial and technical infrastructure and has attracted a considerable amount of foreign investment. It is commendable that both countries have achieved stellar economic performance despite the lack of natural resources and large land size. Unicorn Ventures strives to study the current start-up ecosystem in these two city-based regions and hope to generate new insights for policy-makers, founders and investors.
As there is a general lack of effective and user-friendly visualization for discovering country-specific differences between the start-up ecosystems, the main motivation behind this project is to create a centralized, dynamic and interactive dashboard for quantitative comparisons on various aspects of start-ups and funding organizations in Singapore and Hong Kong. Based on User-Centric Dashboard Design Guide, this dashboard takes a broad, strategic, customizable, drillable and exploratory approach and is targeted at potential entrepreneurs, policy makers and investors.
This project will focus on start-up companies and funding organizations in the tech ecosystem. The insights generated could help:
- Enable potential entrepreneurs to understand the growing and declining industries, investors’ profile as well as pinpoint the top funded start-ups
- Help policy makers to identify the potential profitable and leading industries and dedicate more resources in specific industries
- Assist investors in identifying the difference between Singapore and Hong Kong’s start-up industries and strategizing future investments in these two regions
Our project aims to explore and compare the following aspects for the start-up ecosystem in Singapore and Hong Kong by considering the start-ups founded after 2000. We hope to address the following questions
For Entrepreneurs:
- Time-series analysis: When was the start-ups founded, exited and funded?
- Funding Analysis: Discovering the top funded start-ups
- Spatial Analysis: Where do the investors originate from?
For Policy Makers/Investors:
- Profile Analysis: What are the differences in terms of start-up formation across the years?
- Industry Analysis: Comparing the start-ups in various industries and sectors based on different performance indicators
| Dataset | |||||||||||||||||||||||||||||||||||||||
|---|---|---|---|---|---|---|---|---|---|---|---|---|---|---|---|---|---|---|---|---|---|---|---|---|---|---|---|---|---|---|---|---|---|---|---|---|---|---|---|
| |||||||||||||||||||||||||||||||||||||||
| |||||||||||||||||||||||||||||||||||||||
| |||||||||||||||||||||||||||||||||||||||
|
| Related Works | What We Can Learn |
|---|---|
| |
| |
|
A violin plot show more information in one plot:
This can be used for our industry analysis to achieve a more insightful visualization | |
|
| Sketches | How Analyst Can Conduct Analysis |
|---|---|
|
Heat Map:
| |
|
Cleveland Dot Plot with Filters:
| |
|
Violin Plot with filters:
| |
|
|
Dot Density Map:
|
Domain Knowledge Understanding:
- As the datasets involves many technical terms in the startup ecosystem, the group has to study more in-depth on the terminologies used in the ecosystem in order to draw meaningful insights. This includes the definition of different funding stages, types of fundings, types of investors, startup industries categories and etc.
Data Preprocessing:
- Missing data: how to deal with missing values
- Data integration and calculation: understanding the column attributes and perform meaningful summation or calculation
- Multiple values for certain observations: how to deal with such attributes and ensure that the visualizations take into account of start-ups that has attributes with multiple values
Technological Expertise:
- Learning relevant packages under R such as ggplot2, tidyverse, shiny and plotly
- Learning how to integrate D3.js with R to achieve both advanced analytics functions as well as interactive visualization
- Learning integration of different charts and enhance the interactivity and animation techniques of the storyboard
- Global Startup Ecosystem Report 2017
- UC Business Analytics R Programming Guide on Cleaveland Dot Plot
- Data Visualisation Catalogue on Violin Plot
- Data Viz: Give Your Maps Some Hex Appeal
- Crunchbase
Feel free to comments, suggestions and feedbacks to help us improve our project!:D

