Difference between revisions of "IS428 AY2018-19T1 Tan Xinyi"
(Created page with "== Problem & Motivation == <p>Air pollution is an important risk factor for health in Europe and worldwide. A recent review of the global burden of disease showed that it is o...") |
|||
| (3 intermediate revisions by the same user not shown) | |||
| Line 67: | Line 67: | ||
<p>This able allows you to view the correlation between the different weather conditions with PM10 concentration levels across all 5 stations. It is flexible as you are able to select by the different stations and type pf weather conditions</p> | <p>This able allows you to view the correlation between the different weather conditions with PM10 concentration levels across all 5 stations. It is flexible as you are able to select by the different stations and type pf weather conditions</p> | ||
<p>Interesting Findings: | <p>Interesting Findings: | ||
| − | [[File: StationTrend. | + | [[File: StationTrend.PNG|800px|center]] |
* all 5 stations have the same pattern observed | * all 5 stations have the same pattern observed | ||
* concentration peaks towards the end of the year | * concentration peaks towards the end of the year | ||
* 2013 and 2015 had more important pollutions then over years | * 2013 and 2015 had more important pollutions then over years | ||
| − | [[File: | + | [[File: Windspeed.PNG|800px|center]] |
*windspeed, relative humidity, surface pressure and temperature has similar trends | *windspeed, relative humidity, surface pressure and temperature has similar trends | ||
*windspeed picked up after late 2016, this might cause pollution to decrease and blown to neighboring areas | *windspeed picked up after late 2016, this might cause pollution to decrease and blown to neighboring areas | ||
| − | [[File: | + | [[File: Precipitation.PNG|800px|center]] |
*only precipitation has a reverse pattern observed as compare to the rest | *only precipitation has a reverse pattern observed as compare to the rest | ||
*however this observation is still made around the same time period | *however this observation is still made around the same time period | ||
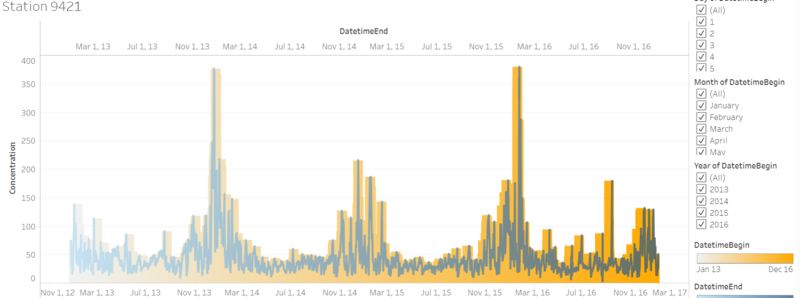
| − | [[File: | + | [[File: Higher.PNG|800px|center]] |
*stations 9421, 9484 and 9616 have relatively higher concentrations of pm10 as compared to the rest | *stations 9421, 9484 and 9616 have relatively higher concentrations of pm10 as compared to the rest | ||
*all stations have the same pattern observed | *all stations have the same pattern observed | ||
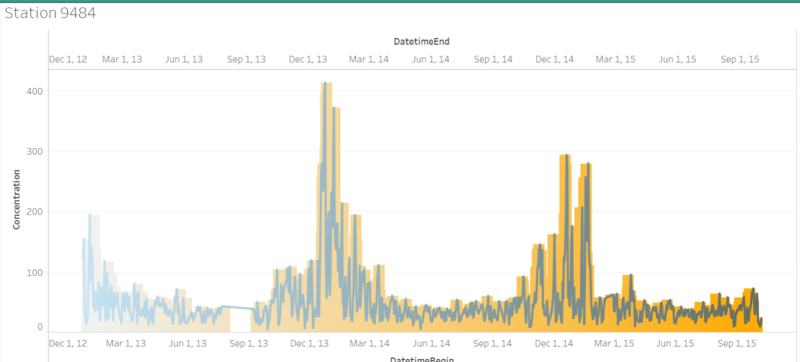
* one thing to note was that statin 9484 has missing datapoints | * one thing to note was that statin 9484 has missing datapoints | ||
| − | [[File: 484. | + | [[File: 484.PNG|800px|center]] |
Ref: | Ref: | ||
* https://public.tableau.com/profile/xinyi8281#!/vizhome/9421/Sheet1?publish=yes | * https://public.tableau.com/profile/xinyi8281#!/vizhome/9421/Sheet1?publish=yes | ||
| Line 97: | Line 97: | ||
<p>This able allows you to view the correlation between the different weather conditions with PM10 concentration levels across all 5 stations. It is flexible as you are able to select by the different stations and type pf weather conditions</p> | <p>This able allows you to view the correlation between the different weather conditions with PM10 concentration levels across all 5 stations. It is flexible as you are able to select by the different stations and type pf weather conditions</p> | ||
<p> Stations were compared across the same year: | <p> Stations were compared across the same year: | ||
| − | [[File: 20132014. | + | [[File: 20132014.PNG|800px|center]] |
* The peaks observed for 2013 and 2014 were opposite | * The peaks observed for 2013 and 2014 were opposite | ||
* in 2016, given the yearly data, the same drastic change was observed at the peaks of year end and beginning of the year. | * in 2016, given the yearly data, the same drastic change was observed at the peaks of year end and beginning of the year. | ||
| − | [[File: 2016trend. | + | [[File: 2016trend.PNG|800px|center]] |
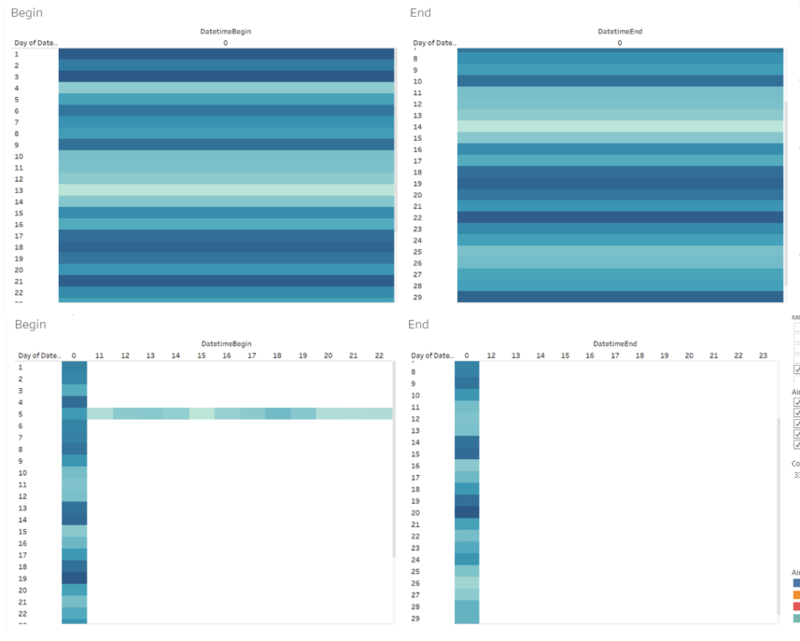
| − | [[File: | + | [[File: DrasticChanges.PNG|800px|center]] |
</p> | </p> | ||
| − | + | ||
=== Task 2 === | === Task 2 === | ||
=== Citizen Data === | === Citizen Data === | ||
| Line 109: | Line 109: | ||
* as the number of rows were too much, tableau was not able to support it. Please download the file and open in desktop application</p> | * as the number of rows were too much, tableau was not able to support it. Please download the file and open in desktop application</p> | ||
[[File: citizen.twb|80px|center]] | [[File: citizen.twb|80px|center]] | ||
| − | [[File: | + | [[File: Db1.PNG|800px|center]] |
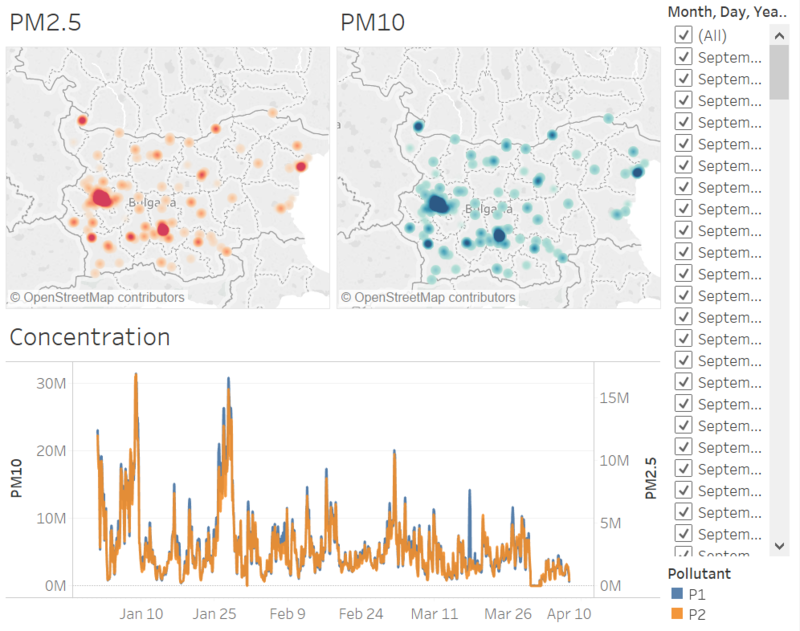
<p>This dashboard shows the concentration of both PM2.5 and 10 across the city: | <p>This dashboard shows the concentration of both PM2.5 and 10 across the city: | ||
* this depicts that it was not extensive in coverage | * this depicts that it was not extensive in coverage | ||
| Line 116: | Line 116: | ||
* overtime, points to note were beginning and end of January 2018 | * overtime, points to note were beginning and end of January 2018 | ||
We can toggle across time to observe both short and longer period on the behavior of both pollutants </p> | We can toggle across time to observe both short and longer period on the behavior of both pollutants </p> | ||
| − | [[File: | + | [[File: Db2.PNG|800px|center]] |
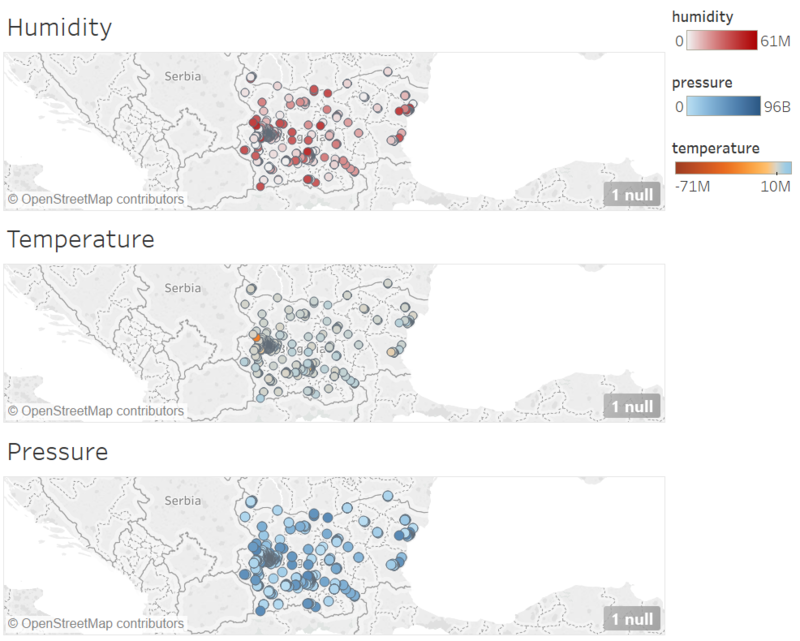
<p> It can be observed that: | <p> It can be observed that: | ||
* places where it was rather polluted, had lower pressure and humidity with low but positive temperature</p> | * places where it was rather polluted, had lower pressure and humidity with low but positive temperature</p> | ||
| − | [[File: | + | [[File: Db3.PNG|800px|center]] |
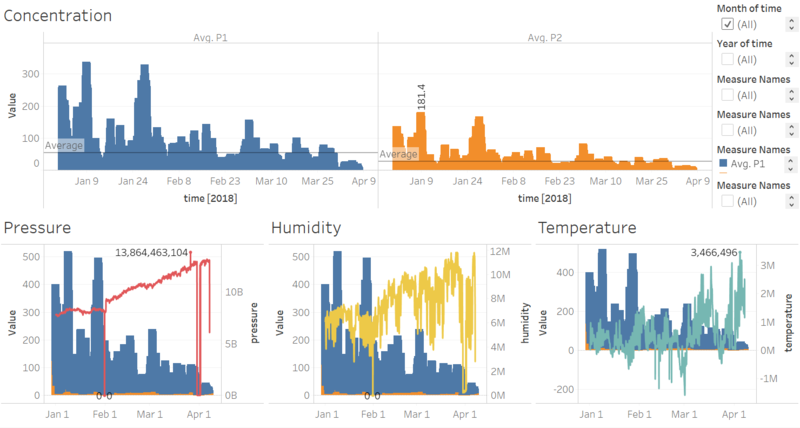
<p> It can be observed that: | <p> It can be observed that: | ||
* Pollution for both particles were higher in the beginning of the year | * Pollution for both particles were higher in the beginning of the year | ||
*pollution of PM10 is significantly higher than PM2.5 | *pollution of PM10 is significantly higher than PM2.5 | ||
*dips in temperature, humidity and pressure showed lack and incomplete data</p> | *dips in temperature, humidity and pressure showed lack and incomplete data</p> | ||
| − | [[File: | + | [[File: Task3-1.PNG|800px|center]] |
<p>Interesting findings that pollution is less evident in summer</p> | <p>Interesting findings that pollution is less evident in summer</p> | ||
[[File: 2018both.twb|800px|center]] | [[File: 2018both.twb|800px|center]] | ||
| − | [[File: | + | [[File: Db4.PNG|800px|center]] |
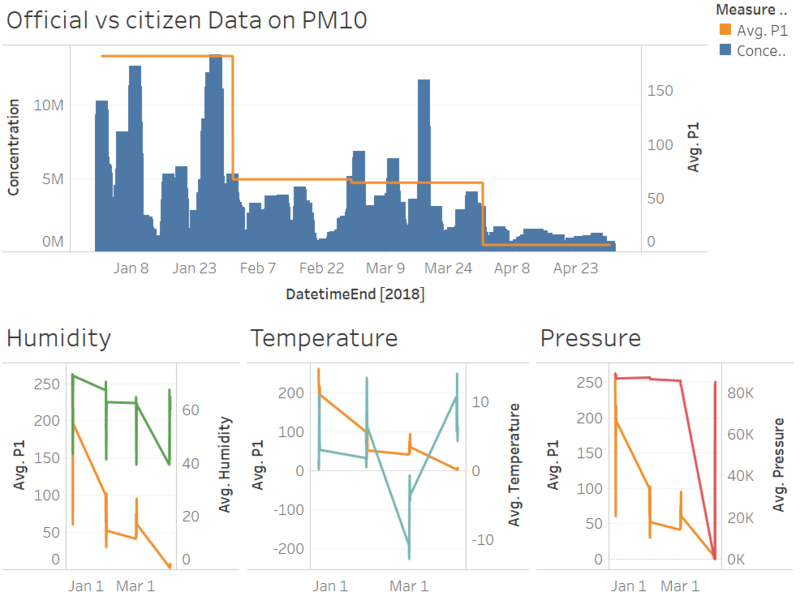
<p>When comparing official dataset with citizen provided data: | <p>When comparing official dataset with citizen provided data: | ||
* It can be observed that the general trend is well reflected with little discrepancies | * It can be observed that the general trend is well reflected with little discrepancies | ||
Latest revision as of 12:48, 12 November 2018
Contents
Problem & Motivation
Air pollution is an important risk factor for health in Europe and worldwide. A recent review of the global burden of disease showed that it is one of the top ten risk factors for health globally. Worldwide an estimated 7 million people died prematurely because of pollution; in the European Union (EU) 400,000 people suffer a premature death. The Organisation for Economic Cooperation and Development (OECD) predicts that in 2050 outdoor air pollution will be the top cause of environmentally related deaths worldwide. In addition, air pollution has also been classified as the leading environmental cause of cancer. Air quality in Bulgaria is a big concern: measurements show that citizens all over the country breathe in air that is considered harmful to health. For example, concentrations of PM2.5 and PM10 are much higher than what the EU and the World Health Organization (WHO) have set to protect health. Bulgaria had the highest PM2.5 concentrations of all EU-28 member states in urban areas over a three-year average. For PM10, Bulgaria is also leading on the top polluted countries with 77 μg/m3on the daily mean concentration (EU limit value is 50 μg/m3). According to the WHO, 60 percent of the urban population in Bulgaria is exposed to dangerous (unhealthy) levels of particulate matter (PM10).
The interactive visualization can be targeted at showing pollution trends with respect to official and citizen provided data:
- By Year
- Per Station
- Changes observed in weather conditions
Dataset Analysis & Transformation Process
Before the analysis began, the dataset given is analyzed to identify its respective format and attributes. There were 4 main data sets provided in the assignment and each has its own unique ways to process and make sense of the data to bring value to the analysis.
This section will elaborate on the dataset analysis and transformation process for each dataset in order to prepare the data for import and analysis on an interactive visualization.
Official air quality measurements
Official air quality measurements (5 stations in the city)(EEA Data.zip) – as per EU guidelines on air quality monitoring. Data provided for 5 stations situated in the city and over the years 2013 to 2018. Data from 2017 not used as there were missing data for the months of Jan to Nov. There were also analyzes different as data for 2016 and 2018 are hourly and the rest are daily. The main columns taken were:
- concentration
- DateTime Begin
- DateTime End
Citizen science air quality measurements
Citizen science air quality measurements (Air Tube.zip) , incl. temperature, humidity and pressure (many stations) and topography (gridded data). Data provided only for the year 2017 and 2018. Additional processing done with python to convert geohash to latitude and longitude to obtain specific points on the map. The main columns taken were:
- P1
- P2
- Lat
- Lon
- Time
Topography data
Showed relation between elevation and the latitude wit longitude. The main columns taken were:
- Lat
- Lon
- Elevation
Meteorological measurements
Meteorological measurements The main columns taken were:
- Year
- Temperature
- Humidity
- Wind speed
- Pressure
- Rainfall
Data Processing
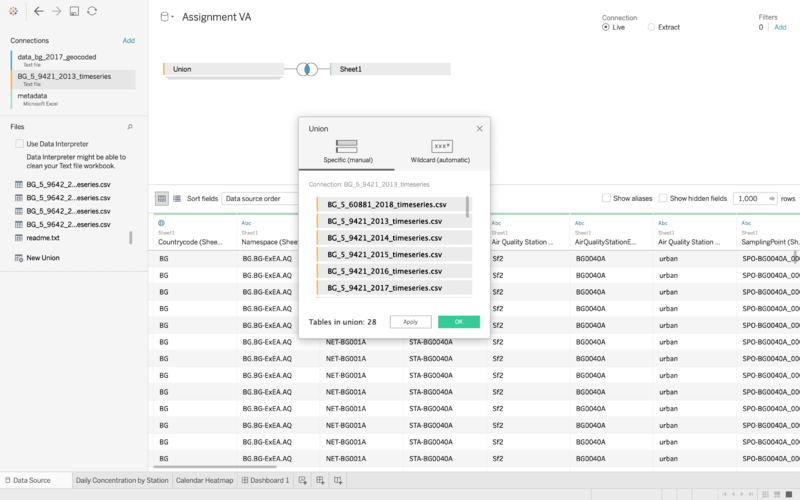
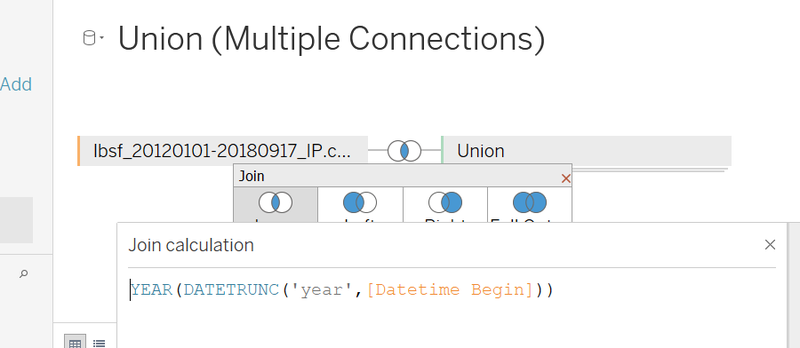
The tableau function of Union was used to group different csv files into the same year or stations
Joining of table across different data sets was done by joining the appropriate time value such as year, month or time accordingly
Task 1
Station Analysis
The interactive visualization can be accessed here: https://public.tableau.com/profile/xinyi8281#!/vizhome/Stations_5/Dashboard1?publish=yes
For the best experience, adjust your screen resolution to 1500x800 and enable full screen on the browser. Adjust the dashboard so that all elements can be clearly visible without the need to scroll up/down.
This able allows you to view the correlation between the different weather conditions with PM10 concentration levels across all 5 stations. It is flexible as you are able to select by the different stations and type pf weather conditions
Interesting Findings:
- all 5 stations have the same pattern observed
- concentration peaks towards the end of the year
- 2013 and 2015 had more important pollutions then over years
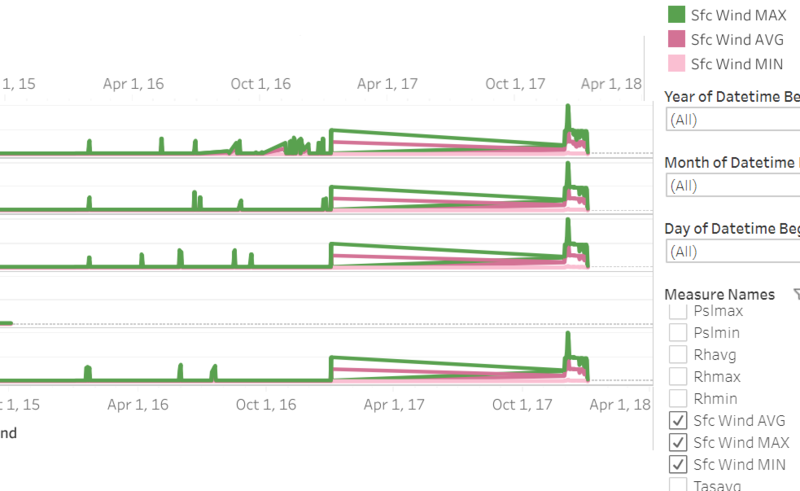
- windspeed, relative humidity, surface pressure and temperature has similar trends
- windspeed picked up after late 2016, this might cause pollution to decrease and blown to neighboring areas
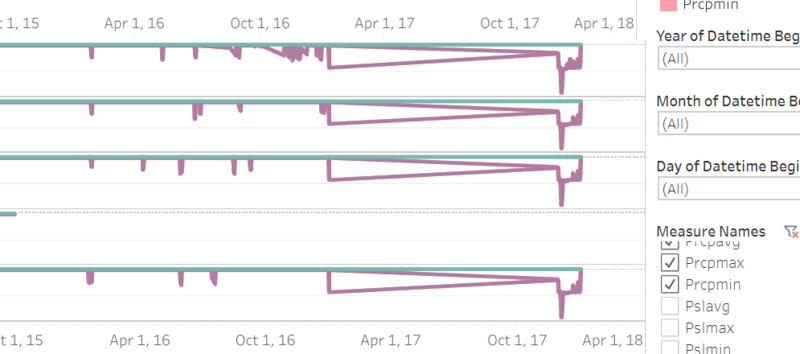
- only precipitation has a reverse pattern observed as compare to the rest
- however this observation is still made around the same time period
- stations 9421, 9484 and 9616 have relatively higher concentrations of pm10 as compared to the rest
- all stations have the same pattern observed
- one thing to note was that statin 9484 has missing datapoints
Ref:
- https://public.tableau.com/profile/xinyi8281#!/vizhome/9421/Sheet1?publish=yes
- https://public.tableau.com/profile/xinyi8281#!/vizhome/9642/Sheet1?publish=yes
- https://public.tableau.com/profile/xinyi8281#!/vizhome/9616/Sheet1?publish=yes
- https://public.tableau.com/profile/xinyi8281#!/vizhome/9572/Sheet1?publish=yes
Yearly Analysis
The interactive visualization can be accessed here:
- https://public.tableau.com/profile/xinyi8281#!/vizhome/2013_169/Dashboard1?publish=yes
- https://public.tableau.com/profile/xinyi8281#!/vizhome/2014_223/Dashboard1?publish=yes
- https://public.tableau.com/profile/xinyi8281#!/vizhome/2015_305/Dashboard1?publish=yes
- https://public.tableau.com/profile/xinyi8281#!/vizhome/2016_367/Dashboard1?publish=yes
For the best experience, adjust your screen resolution to 1500x800 and enable full screen on the browser. Adjust the dashboard so that all elements can be clearly visible without the need to scroll up/down.
This able allows you to view the correlation between the different weather conditions with PM10 concentration levels across all 5 stations. It is flexible as you are able to select by the different stations and type pf weather conditions
Stations were compared across the same year:
- The peaks observed for 2013 and 2014 were opposite
- in 2016, given the yearly data, the same drastic change was observed at the peaks of year end and beginning of the year.
Task 2
Citizen Data
The following shows the dashboard with citizen data:
- as the number of rows were too much, tableau was not able to support it. Please download the file and open in desktop application
This dashboard shows the concentration of both PM2.5 and 10 across the city:
- this depicts that it was not extensive in coverage
- the west side was relatively more polluted
- both particles has relatively similar patterns and concentration
- overtime, points to note were beginning and end of January 2018
We can toggle across time to observe both short and longer period on the behavior of both pollutants
It can be observed that:
- places where it was rather polluted, had lower pressure and humidity with low but positive temperature
It can be observed that:
- Pollution for both particles were higher in the beginning of the year
- pollution of PM10 is significantly higher than PM2.5
- dips in temperature, humidity and pressure showed lack and incomplete data
Interesting findings that pollution is less evident in summer
When comparing official dataset with citizen provided data:
- It can be observed that the general trend is well reflected with little discrepancies
- Exception of March 18th where there was a spike according to data provided by the stations but not observed by the citizens
It can also be seen that the weather conditions have in correlation to the citize collected data: 1.Humidity: both decreasing 2.Temperature: has no obvious trends 3.Pressure: sharp decrease in pressure with lower pollution levels
Task 3
Bulgaria’s main sources of PM10, and fine particle pollution PM2.5 (particles 2.5 microns or smaller) are household burning of fossil fuels or biomass, and transport. Hence in general, the government should place stricter regulations on PM10 contributors over PM2.5 contributors. Current considerable measures looked into are: > Reducing the ticket prices in public transport or giving them away for free > “Easier” parking at Metro stations outside the city centre > A sharp increase in parking fees in the Blue Zone located in the city centre > The most radical one: A driving ban Other relationships have been explored through task 1 and 2
URL links to dashboards
- https://public.tableau.com/profile/xinyi8281#!/vizhome/Stations_5/Dashboard1?publish=yes
- https://public.tableau.com/profile/xinyi8281#!/vizhome/2018withmeteo/Dashboard1?publish=yes
- https://public.tableau.com/profile/xinyi8281#!/vizhome/9421/Sheet1?publish=yes
- https://public.tableau.com/profile/xinyi8281#!/vizhome/9642/Sheet1?publish=yes
- https://public.tableau.com/profile/xinyi8281#!/vizhome/9616/Sheet1?publish=yes
- https://public.tableau.com/profile/xinyi8281#!/vizhome/9572/Sheet1?publish=yes
- https://public.tableau.com/profile/xinyi8281#!/vizhome/948411/Sheet1?publish=yes
- https://public.tableau.com/profile/xinyi8281#!/vizhome/2013_169/Dashboard1?publish=yes
- https://public.tableau.com/profile/xinyi8281#!/vizhome/2014_223/Dashboard1?publish=yes
- https://public.tableau.com/profile/xinyi8281#!/vizhome/2016_367/Dashboard1?publish=yes
- https://public.tableau.com/profile/xinyi8281#!/vizhome/2015_305/Dashboard1?publish=yes
References
- https://sofiaglobe.com/2017/12/13/air-pollution-in-sofia-drastic-measures-envisaged/
- https://www.researchgate.net/figure/Surface-PM-25-typical-annual-summer-and-winter-concentrations-mg-m-3-at-0700_fig1_290310814
Comments
Please provide your kind feedbacks, thank you!
