Difference between revisions of "IS428 AY2018-19T1 Nguyen Dang Thanh Ha"
| (One intermediate revision by the same user not shown) | |||
| Line 11: | Line 11: | ||
As a Visual Detective, you are required to use visual analytics approach to reveal spatio-temporal patterns of air quality in Sofia City and to identify issues of concern. | As a Visual Detective, you are required to use visual analytics approach to reveal spatio-temporal patterns of air quality in Sofia City and to identify issues of concern. | ||
You will answer the following questions that came in 03 tasks: | You will answer the following questions that came in 03 tasks: | ||
| + | |||
Task 1: Spatio-temporal Analysis of Official Air Quality | Task 1: Spatio-temporal Analysis of Official Air Quality | ||
*What does a typical day look like for Sofia city? | *What does a typical day look like for Sofia city? | ||
| Line 101: | Line 102: | ||
= Task 3 Findings = | = Task 3 Findings = | ||
[[File:Meteo.png|800px|thumb|center]] | [[File:Meteo.png|800px|thumb|center]] | ||
| + | [[File:Efeee efef.png|800px|thumb|center]] | ||
Based on this chart,it is apparent that P1 concentrations were the least affected by atmospheric pressure, reflected through the changes of P1 values over a very wide range of pressure readings. In contrast, P1 concentrations appeared to be affected the most by wind speed, then by humidity, and temperature in the third place. This finding is consistent with the one from the studies of Tecer et al. (2012) and Barmpadimos et al.(2011). As these studies explained, the higher the wind speed, the faster the particles moved away from the area, and this factor could strongly influence the P1 concentrations in the area all year round (Barmpadimos et al. 2011). As observed in this chart, the higher the wind speed, the less sensors recording high P1 concentrations. The study of Barmpadimos et al. (2011) also found a negative relationship between humidity and particles matters in the atmosphere that was reflected in this chart, where the higher humidity levels correlate with less high-value P1 readings. In the case of temperature, as Tecer et al. (2012) and Barmpadimos et al. (2011) explained, low wind speed and temperature could enhance the formation of stagnant air masses, which retained the particles in the atmosphere at an area for a long time, therefore it can rise the values of P1 readings. This effect can be observed in this chart, with the higher the temperature corresponding with less sensors recording high P1. | Based on this chart,it is apparent that P1 concentrations were the least affected by atmospheric pressure, reflected through the changes of P1 values over a very wide range of pressure readings. In contrast, P1 concentrations appeared to be affected the most by wind speed, then by humidity, and temperature in the third place. This finding is consistent with the one from the studies of Tecer et al. (2012) and Barmpadimos et al.(2011). As these studies explained, the higher the wind speed, the faster the particles moved away from the area, and this factor could strongly influence the P1 concentrations in the area all year round (Barmpadimos et al. 2011). As observed in this chart, the higher the wind speed, the less sensors recording high P1 concentrations. The study of Barmpadimos et al. (2011) also found a negative relationship between humidity and particles matters in the atmosphere that was reflected in this chart, where the higher humidity levels correlate with less high-value P1 readings. In the case of temperature, as Tecer et al. (2012) and Barmpadimos et al. (2011) explained, low wind speed and temperature could enhance the formation of stagnant air masses, which retained the particles in the atmosphere at an area for a long time, therefore it can rise the values of P1 readings. This effect can be observed in this chart, with the higher the temperature corresponding with less sensors recording high P1. | ||
Latest revision as of 00:00, 12 November 2018
Contents
Overview
Air pollution is an important risk factor for health in Europe and worldwide. A recent review of the global burden of disease showed that it is one of the top ten risk factors for health globally. Worldwide an estimated 7 million people died prematurely because of pollution; in the European Union (EU) 400,000 people suffer a premature death. The Organisation for Economic Cooperation and Development (OECD) predicts that in 2050 outdoor air pollution will be the top cause of environmentally related deaths worldwide. In addition, air pollution has also been classified as the leading environmental cause of cancer.
Air quality in Bulgaria is a big concern: measurements show that citizens all over the country breathe in air that is considered harmful to health. For example, concentrations of PM2.5 and PM10 are much higher than what the EU and the World Health Organization (WHO) have set to protect health.
Bulgaria had the highest PM2.5 concentrations of all EU-28 member states in urban areas over a three-year average. For PM10, Bulgaria is also leading on the top polluted countries with 77 μg/m3on the daily mean concentration (EU limit value is 50 μg/m3).
According to the WHO, 60 percent of the urban population in Bulgaria is exposed to dangerous (unhealthy) levels of particulate matter (PM10).
The Tasks
As a Visual Detective, you are required to use visual analytics approach to reveal spatio-temporal patterns of air quality in Sofia City and to identify issues of concern. You will answer the following questions that came in 03 tasks:
Task 1: Spatio-temporal Analysis of Official Air Quality
- What does a typical day look like for Sofia city?
- Do you see any trends of possible interest in this investigation?
- What anomalies do you find in the official air quality dataset? How do these affect your analysis of potential problems to the environment?
Task 2: Spatio-temporal Analysis of Citizen Science Air Quality Measurements
- Characterize the sensors’ coverage, performance and operation.
- Are they well distributed over the entire city?
- Are they all working properly at all times? Can you detect any unexpected behaviors of the sensors through analyzing the readings they capture?
- Now turn your attention to the air pollution measurements themselves. Which part of the city shows relatively higher readings than others? Are these differences time dependent?
Task 3: Urban air pollution is a complex issue. There are many factors affecting the air quality of a city. Some of the possible causes are:
- Local energy sources (For example, according to Unmask My City, a global initiative by doctors, nurses, public health practitioners, and allied health professionals dedicated to improving air quality and reducing emissions in our cities, Bulgaria’s main sources of PM10, and fine particle pollution PM2.5 (particles 2.5 microns or smaller) are household burning of fossil fuels or biomass, and transport.
- Local meteorology such as temperature, pressure, rainfall, humidity, wind etc
- Local topography
- Complex interactions between local topography and meteorological characteristics.
- Transboundary pollution for example the haze that intruded into Singapore from our neighbours.
In this third task, you are required to reveal the relationships between the factors mentioned above and the air quality measure detected in Task 1 and Task 2.
Project Motivation
- Provide insights on the variation of PM10 concentrations in the atmosphere of Sofia city during 24 hours of a day and 12 months of a year.
- Identify the source of PM10 based on analysis of the patterns of varriation in relation with other factors such as time of recordings, topography and demogrpahy of the monitored areas.
- Identify any anomalies in the official air quality dataset that could affect the analysis of potential problems to the environment caused by PM10.
- Examine the quality of the Citizen Science Air Quality Measurements dataset.
- Analyse the variation in environmental parameters from the Citizen Science Air Quality Measurements dataset.
- Identify the relationship between the factors such as local energy sources, meteorology, topography, transboundary pollution and air quality measures provided in the abovementioned datasets.
These insights will support the city authority in identifying the root cause of atmospheric pollution, partucularly the PM10 issue, in their city, and from that suggesting long-term solutions for this problem.
Given Datasets
Four major data sets in zipped file format are provided for this assignment, they are:
- Official air quality measurements (5 stations in the city)(EEA Data.zip)
- As per EU guidelines on air quality monitoring.
- PM10 measurements collected from 6 official air quality monitoring stations in Sofia.
- Citizen science air quality measurements (Air Tube.zip)
- Include temperature, humidity and pressure (many stations) and topography (gridded data).
- PM10 and PM2.5 measurements collected from local scientists' sensors.
- Meteorological measurements (1 station)(METEO-data.zip)
- Include Temperature; Humidity; Wind speed; Pressure; Rainfall; Visibility.
- Historical meteorological data from Sofia.
- Topography data (TOPO-DATA)
- Topological data for points around Sofia
Data Processing
EEA Dataset
| Problem | Solution |
|---|---|
| Yearly measurements are stored in seperate files so we need to merge them all together into one single file. | |
| The longtitude and latitude of the station collecting the measurements are not included in the dataset but in a separate metadata file. Therefore, the metadata is then merged into the EEA dataset based on the Air Quality Station EOI Code. | |
| Mladost station only has data from 2017 - 2018 and Orlov Most station only has data from 2013 - 2015. Therefore, to avoid biases in the findings, these two stations will be removed from the analysis. | |
| Measurements are collected on 3 bases: day, hour and var and this will affect the time series analysis | The analysis is performed on DatetimeBegin variable only so there will be no interday analysis for one measurement |
Air Tube Dataset
| Problem | Solution |
|---|---|
| There are no longtitude and latitude in the dataset, instead, the geohash of each station is given | Use Geohash library in the R tutorial given in class to decode the geohash into longtitude and latitude |
Task 1 Findings
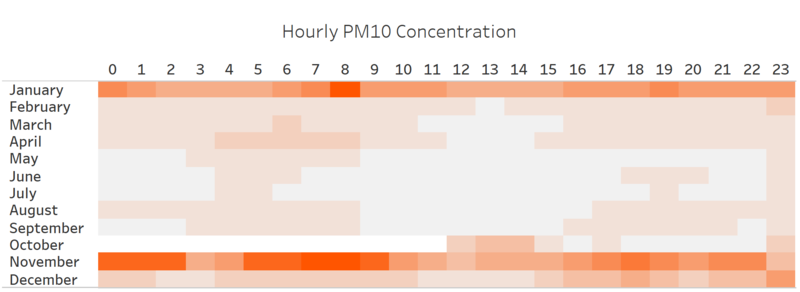
Chart Hourly PM10 Concentration displays the hourly variation of PM10 concentration in the atmosphere of Sofia city from 2012 to 2018 shows a typical day in Sofia city to have consistently low PM10 in the atmosphere throughout the day in mid-Spring and Autumn months. In the Winter and early-Spring periods (around November to January), the concentration is high from midnight until around 11am. This trend suggests that the reason for the rise of PM10 concentrations in the atmosphere could be due to fossil fuel consumption, as the period during which PM10 appeared to spike corresponds with the time of the day and year when people tend to burn more fossil fuel for heating.
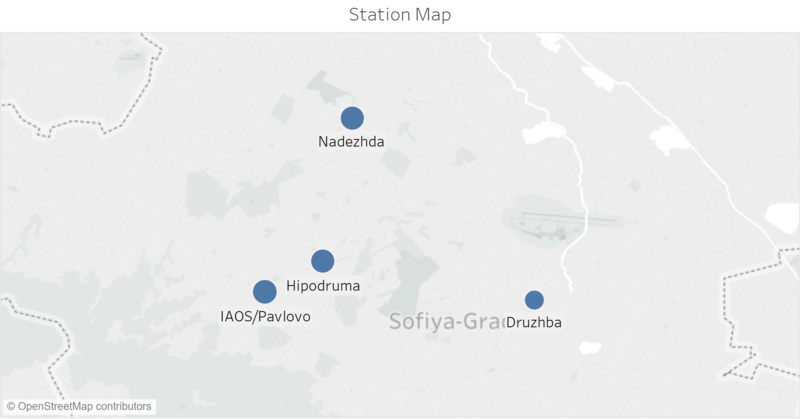
Moreover, examination of Station Map also revealed that the highest concentrations of PM10 were mostly recorded in Hipodruma, the downtown of Sofia City with high population, also suggesting that the source of PM10 was fossil fuel consumption for anthropogenic activities.
However, chart Daily PM10 Concentration also displayed a number of anomalities, among which is the low concentration of PM10 in December 2016. This may affect the analysis of PM10's source in the city since there can be another cause for the fluctuation of PM10 aside from fossil fuel combustion for heating. One must take into account that the analysis is completely based on the datasets given, from which the seasonal pattern of PM10 concentration fluctuation was apparent. However, there may be other causes that lead to the fluctuation of PM10 concentration that are not considered in this assignment due to lack of data on the demographics of the monitored areas.
Task 2 Findings
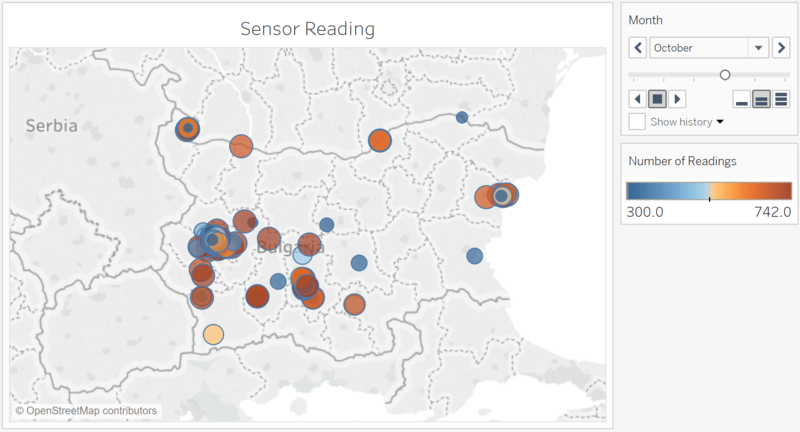
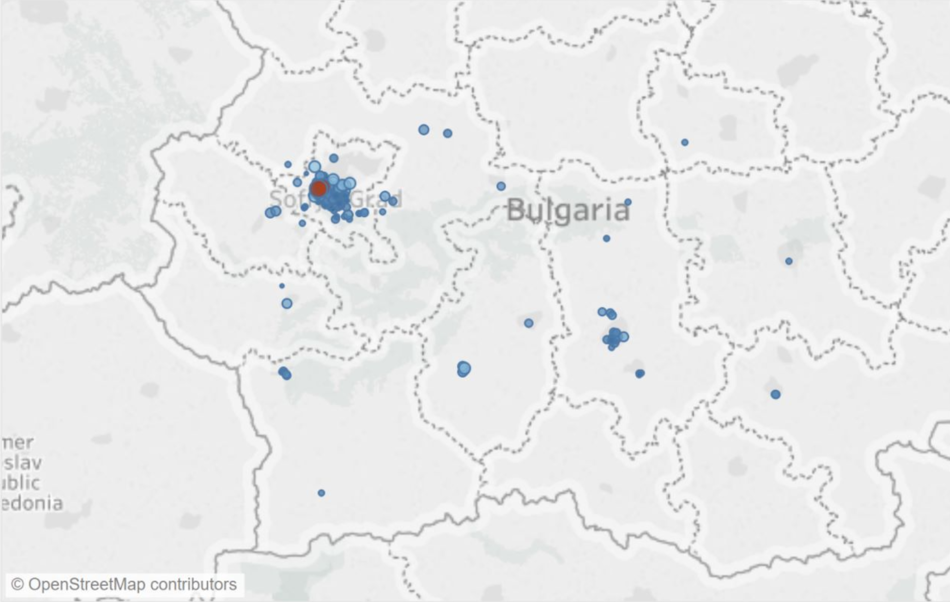
In order to characterize the sensors’ coverage, performance and operation, map Sensor Reading and meteorological factor measurement graphs were constructed. Regarding sensors' coverage, it is apparent in map Sensor Reading that the sensors were installed across Sofia City. However, they were not well-distributed. Most of the sensors gathered in Sofia-grad, the administrative center of Sofia City - Bulgaria’s capital. In the other parts of Sofia City, the sensors were installed scatteredly in the north areas, and only one spotted in the south. Performance of the sensors were displayed in map Station Reading which represents the numbers of readings counted for each sensor in the forms of sizes and colors of the bubbles. Examining the same map reveals that not all sensors had the same numbers of readings, with some having less than the others, which suggested that there could be some sensors had malfunctions and therefore missed a number of readings. It can be concluded that not all sensors worked properly at all times.
Through analyzing the readings that the sensors captured, some unexpected behaviors of the sensors were revealed, that includes the missing of readings from all the sensors from January to August in 2017, and from March to December in 2018. It is apparent that the measures were only recorded by local scientists from September 2017 to February 2018. The number of readings from these sensors were also inconsitent throughout this period. In the first and last months of recording, September 2017 and February 2018 respectively, the numbers of readings were considerably lower than the other months.
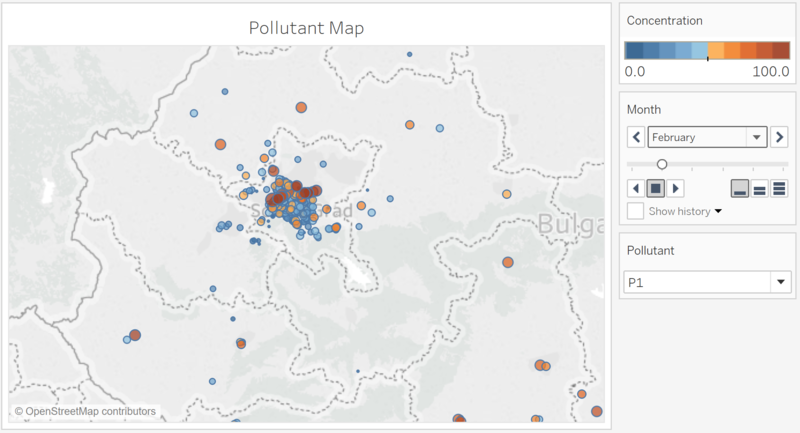
To examine the air pollution measurements taken by these sensors, Pollutant Map was constructed to give an overview of the P1 and P2 concentration at different parts of the city in different months of the year. It is apparrent that for both P1 and P2, the concentrations of the highest readings from all sensors increased consistently from September to December 2017, then decreased in January and February 2018. Although the concentrations of the lowest readings did not follow exactly the same pattern, December 2017 was also the month in that the lowest readings of all sensors had the highest concentrations in comparisons with all the other months for both P1 and P2. It is also recognizable that the higher concentrations tend to be recorded in Sofia-grad, the administrative centre of Sofia City.
Task 3 Findings
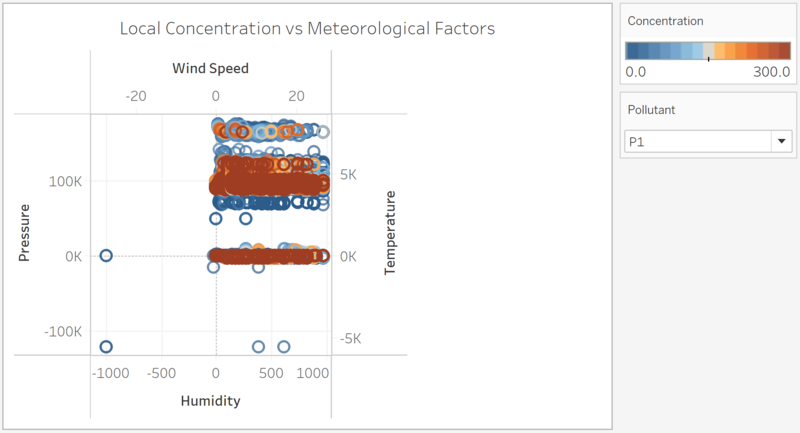
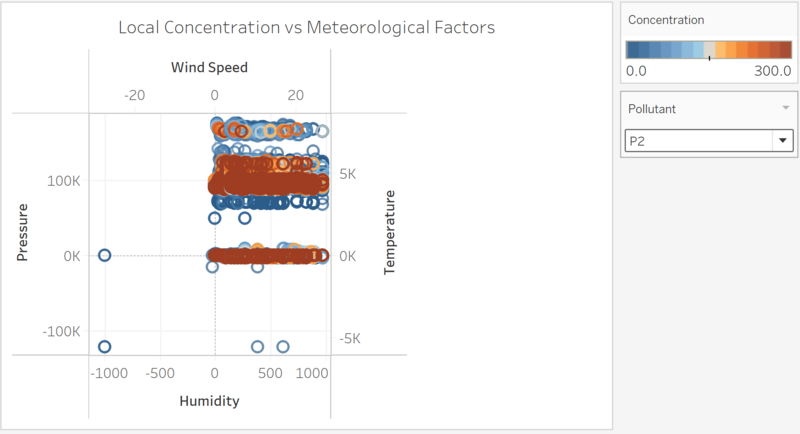
Based on this chart,it is apparent that P1 concentrations were the least affected by atmospheric pressure, reflected through the changes of P1 values over a very wide range of pressure readings. In contrast, P1 concentrations appeared to be affected the most by wind speed, then by humidity, and temperature in the third place. This finding is consistent with the one from the studies of Tecer et al. (2012) and Barmpadimos et al.(2011). As these studies explained, the higher the wind speed, the faster the particles moved away from the area, and this factor could strongly influence the P1 concentrations in the area all year round (Barmpadimos et al. 2011). As observed in this chart, the higher the wind speed, the less sensors recording high P1 concentrations. The study of Barmpadimos et al. (2011) also found a negative relationship between humidity and particles matters in the atmosphere that was reflected in this chart, where the higher humidity levels correlate with less high-value P1 readings. In the case of temperature, as Tecer et al. (2012) and Barmpadimos et al. (2011) explained, low wind speed and temperature could enhance the formation of stagnant air masses, which retained the particles in the atmosphere at an area for a long time, therefore it can rise the values of P1 readings. This effect can be observed in this chart, with the higher the temperature corresponding with less sensors recording high P1.
The same patterns of correlation were observed for P2 concentrations and the provided meteorological parameters, however, in this case, all three factors wind speed, temperature and humidity displayed higher levels of influence over the P2 concentrations. It can be observed that there are less high-value P2 concentrations recorded at higher windspeed, higher temperature and humidity in comparison with the high-value readings of P1 at the similar levels of temperature, humidity and wind speed. This could be due to the differences in the sizes and masses of P1 and P2, with P2 possibly has smaller size and mass than P1, that consequently cause this type of particles to be easier affected by the atmospheric movement and other meteorological factors.
Transboundary pollution
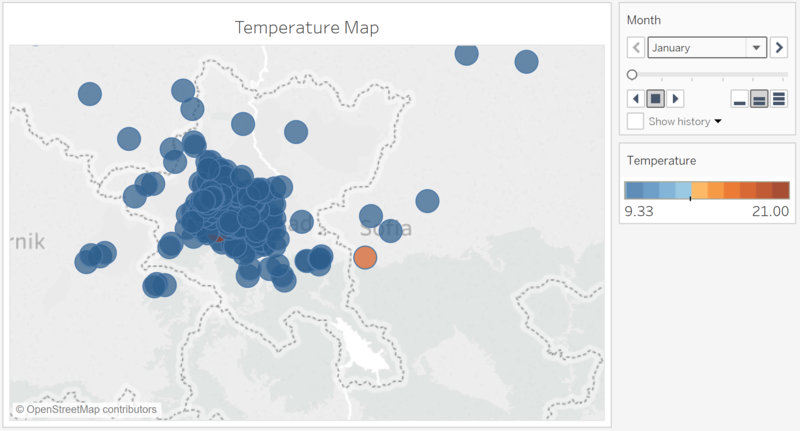
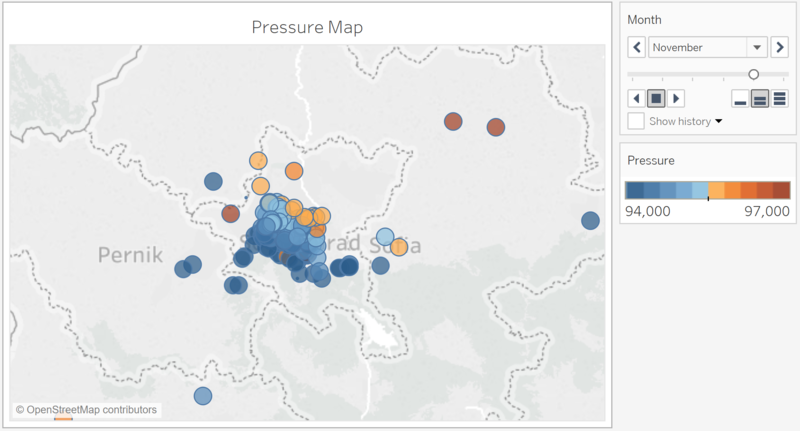
Transboundary pollution issue was examined through the variation of particle matters (PM) concentrations in Sofia city in relation with the variation of PM concentrations in the adjacent areas over a period of time from September 2017 to December 2017, when these concentrations started to rise as the weather changed from autumn to winter and people consume more fossil fuel for heating. As observed in the picture above, the higher level of PM concentrations was first recorded inside Sofia City in October. Higher levels of PM concentrations recorded in the other areas outside Sofia City were not recorded until November. This suggests that air pollution in Sofia City was not caused by transboundary pollution, as the PM concentrations in the outside areas still remained in low levels when the PM concentrations in Sofia City started to rise.
Conclusion
From all the above analysis, it can be concluded that the main source of PM10 and PM2.5 in Sofia City is the consumption of fossil fuel for human activities, particularly for heating during winter. This finding from the dashbard would provide valuable insights for the city authority to identify the root cause of the air pollution problem and from that develope the most suitable solution to tackle it.
Future Improvements
Due to the short operation of the Airtube that only lasted from September 2017 to February 2018, a considerable amount of readings was missed for two seasons summer and autumn, consequently causing a gap in the dataset and greatly limited the analysis of particle matters’ concentrations variation in relation to time and many other seasonal factors. In the future, this study will benefit greatly from a more sufficient dataset that cover all the seasons in a year, and with more years so that frequency of changes can be established.
References
- https://www.datasciencesociety.net/sofia-air-quality-eda-exploratory-data-analysis/
- https://www.datasciencesociety.net/telelink-case-solution/
- Barmpadimos, I., Hueglin, C., Keller, J., Henne, S., & Prévôt, A. S. H. (2011). Influence of meteorology on PM 10 trends and variability in Switzerland from 1991 to 2008. Atmospheric Chemistry and Physics, 11(4), 1813-1835.
- Tecer, L. H., Süren, P., Alagha, O., Karaca, F., & Tuncel, G. (2008). Effect of meteorological parameters on fine and coarse particulate matter mass concentration in a coal-mining area in Zonguldak, Turkey. Journal of the Air & Waste Management Association, 58(4), 543-552.

