Difference between revisions of "UIUX: Proposal"
Jump to navigation
Jump to search
Feel free to comment on our project! 😁
| Line 38: | Line 38: | ||
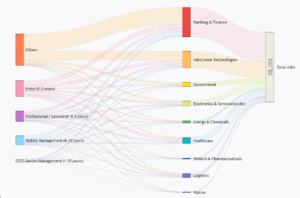
| <center>Sankey</center> | | <center>Sankey</center> | ||
| − | [[File:UIUXsankey.PNG|300px|frameless]] | + | [[File:UIUXsankey.PNG|300px|frameless|center]] |
Sample link: http://bl.ocks.org/d3noob/5028304 | Sample link: http://bl.ocks.org/d3noob/5028304 | ||
| Line 44: | Line 44: | ||
|| Sankey Diagrams display flows and their quantities in proportion to one another. The things being connected are called nodes and the connections are called links. It is best used to show a many-to-many mapping between two domains or multiple paths through a set of stages. Sankey is helpful in locating dominant contributions to an overall flow. | || Sankey Diagrams display flows and their quantities in proportion to one another. The things being connected are called nodes and the connections are called links. It is best used to show a many-to-many mapping between two domains or multiple paths through a set of stages. Sankey is helpful in locating dominant contributions to an overall flow. | ||
|- | |- | ||
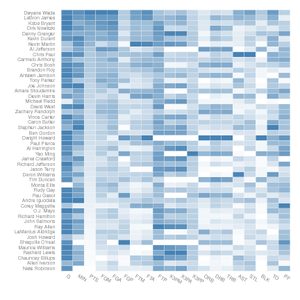
| + | | <center>Multiple Variable Association Grid Heatmap</center> | ||
| + | [[File:UIUXHeatmap.png|300px|frameless|center]] | ||
| + | Sample link:http://bl.ocks.org/josiahdavis/7e488547a6381a365ac9 | ||
| + | |||
| + | || Heatmap is a graphical representation of data where the individual values in the matrix are represented using colors. It is useful for visualizing variance across multiple variables to display patterns in correlations. Each cell represents a correlation between one and another: one along the horizontal, the other along the vertical axis. The darker the shade of color, the larger the degree of correlation between the two axis. | ||
|} | |} | ||
Revision as of 11:42, 14 October 2018
PROBLEM & MOTIVATION
DATA SOURCES
VISUALISATION PLAN
Type of Visualization |
Detailed Description
|
|---|---|
Sample link: http://bl.ocks.org/d3noob/5028304 |
Sankey Diagrams display flows and their quantities in proportion to one another. The things being connected are called nodes and the connections are called links. It is best used to show a many-to-many mapping between two domains or multiple paths through a set of stages. Sankey is helpful in locating dominant contributions to an overall flow. |
Sample link:http://bl.ocks.org/josiahdavis/7e488547a6381a365ac9 |
Heatmap is a graphical representation of data where the individual values in the matrix are represented using colors. It is useful for visualizing variance across multiple variables to display patterns in correlations. Each cell represents a correlation between one and another: one along the horizontal, the other along the vertical axis. The darker the shade of color, the larger the degree of correlation between the two axis. |
PROJECT TIMELINE
TECHNOLOGIES
TECHNICAL CHALLENGES
| Challenges | Mitigation Plan |
|---|---|
|
|
|
|
|
|
COMMENTS
Feel free to comment on our project! 😁


