Difference between revisions of "IS428 AY2018-19T1 Zheng Bingbing"
Bbzheng.2015 (talk | contribs) |
Bbzheng.2015 (talk | contribs) |
||
| (42 intermediate revisions by the same user not shown) | |||
| Line 15: | Line 15: | ||
! Problem #1 || Data merging required for an easy process in the tableau. | ! Problem #1 || Data merging required for an easy process in the tableau. | ||
|- | |- | ||
| − | | Issue || Manual processing | + | | Issue || Manual processing is not convenience to handle the larger number of records. An alternative method of merging data is required. |
|- | |- | ||
| Solution || | | Solution || | ||
| − | [[File:dataclean1.png|700px|center]] | + | [[File:dataclean1.png.png|700px|center]] |
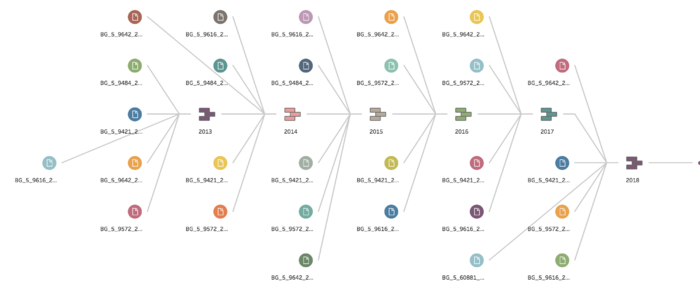
Tableau Prep is using on merging of the data, it allows dynamic views of the output data records. And detecting any unusual behavior before making the visualizations. | Tableau Prep is using on merging of the data, it allows dynamic views of the output data records. And detecting any unusual behavior before making the visualizations. | ||
<br/> | <br/> | ||
|} | |} | ||
| − | == | + | {| class="wikitable" |
| + | |- | ||
| + | ! Problem #2 || Inconsistency of data record time | ||
| + | |- | ||
| + | | Issue || Year 2017 use data recording time as "2017-01-01 01:00:01", ending with ":01", which other records ended with ":00". | ||
| + | |- | ||
| + | | Solution || | ||
| + | [[File:dataclean2.png|700px|center]] | ||
| + | Since we will only be using the hours as the measure, the last second will not have an effort on the result. Furthermore, all the DatatimeEnd are records ended with ":00" second. There is no action required. | ||
| + | <br/> | ||
| + | |} | ||
| + | |||
| + | {| class="wikitable" | ||
| + | |- | ||
| + | ! Problem #3 || Miss data points | ||
| + | |- | ||
| + | | Issue || The Year 2017 have a lot of months without datapoint, furthermore, the year 2018 only have the records till September 14. | ||
| + | |- | ||
| + | | Solution || | ||
| + | [[File:dataclean4.png|700px|center]] | ||
| + | In order to have an overview of the air pollution in Sofia City, the data points from year 2017 and 2018 will keep for the analysis. | ||
| + | <br/> | ||
| + | |} | ||
| + | |||
| + | ===Citizen science air quality measurements (Airtube=== | ||
| + | {| class="wikitable" | ||
| + | |- | ||
| + | ! Problem #1 || Geohash required to be transferred into latlong | ||
| + | |- | ||
| + | | Issue || Tableau does not recognize Geohash code, a transformation of Geohash into latlong is required. | ||
| + | |- | ||
| + | | Solution || | ||
| + | [[File:dataclean3.png|700px|center]] | ||
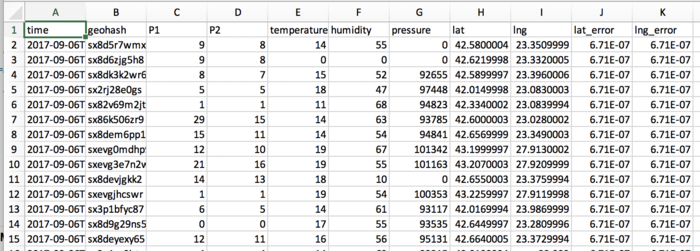
| + | By using the R file provided by Dr.KAM to transfer the geohash into latlong. | ||
| + | <br/> | ||
| + | |} | ||
| + | |||
| + | {| class="wikitable" | ||
| + | |- | ||
| + | ! Problem #2 || Records with sensor data outside of Sofia City | ||
| + | |- | ||
| + | | Issue || Points outside of the Sofia City region required to be removed. | ||
| + | |- | ||
| + | | Solution || | ||
| + | [[File:dataclean5.png|700px|center]] | ||
| + | Those points will be excluded during the processing. | ||
| + | <br/> | ||
| + | |} | ||
==Detail Analysis== | ==Detail Analysis== | ||
===Task 1: Spatio-temporal Analysis of Official Air Quality=== | ===Task 1: Spatio-temporal Analysis of Official Air Quality=== | ||
| + | {| class="wikitable" | ||
| + | |- | ||
| + | ! Characterise the past and most recent situation with respect to air quality measures in Sofia City. | ||
| + | |- | ||
| + | | [[File:b1.1.png|700px|center]] | ||
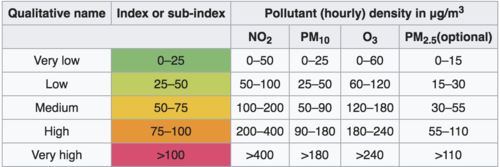
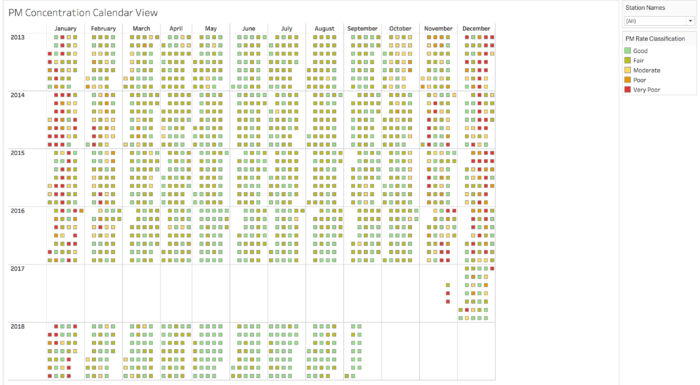
| + | A calendar chart is used to classify the Sofia city's both past and present air quality. The colour classification was followed by the UN Common Air Quality Index (CAQI) with the following setting: <br /> | ||
| + | PM10 concentration 0-25: Good (Light Green) <br /> | ||
| + | PM10 concentration 26-50: Fair (Green) <br /> | ||
| + | PM10 concentration 51-75: Moderate (Yellow) <br /> | ||
| + | PM10 concentration 76-100: Poor (Orange) <br /> | ||
| + | PM10 concentration >100: Very Poor (Red) <br /> | ||
| + | |||
| + | |- | ||
| + | | [[File:b1.2.png|700px|center]] | ||
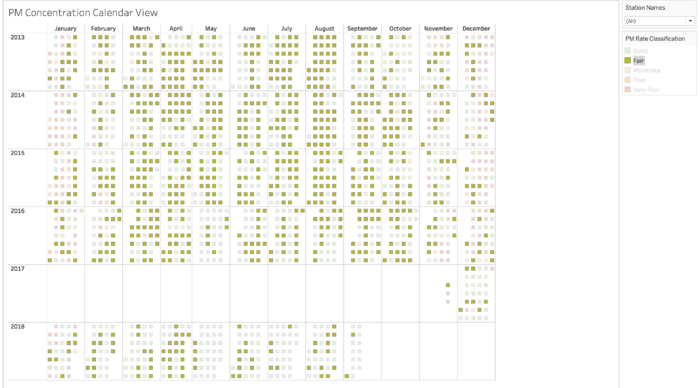
| + | Majority of the weeks were classified as "Fair" in the past years. In recent years, more weeks that classified as "Fair" changed to "Good" condition. | ||
| + | |- | ||
| + | | [[File:b1.3.png|700px|center]] | ||
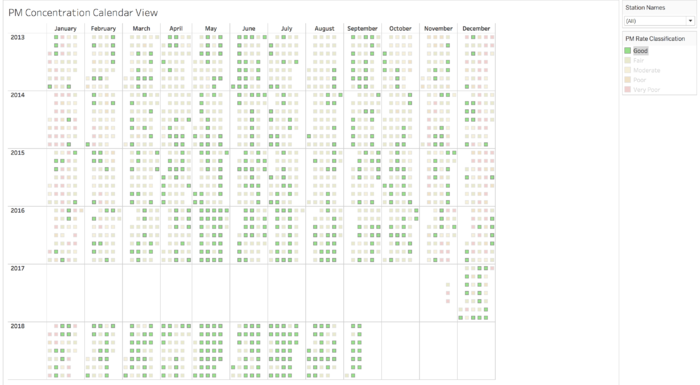
| + | In the recent year 2018, the average weekly PM10 concentration has improved. More weeks are classified as "Good" condition which more less than 25 ug/m3. | ||
| + | |- | ||
| + | | [[File:b1.4.png|700px|center]] | ||
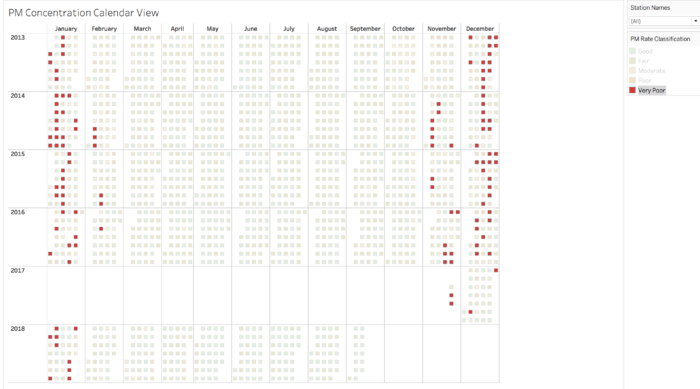
| + | From the above graph, we can observe Sofia has its poorest air quality usually from December till February period. With the recent effort by reducing the PM10 population, we can see an effective reduction of the PM10 concentration on December 2017. There are no weeks classified as "Very Poor" in February 2018, which it does occur in the past years. Reducing the numbers of weeks that classified as "Very Poor" shows Sofia City is improving its air quality. | ||
| + | <br/> | ||
| + | |} | ||
| + | |||
| + | {| class="wikitable" | ||
| + | |- | ||
| + | ! A typical day in Sofia | ||
| + | |- | ||
| + | | [[File:b2.1.png|700px|center]] | ||
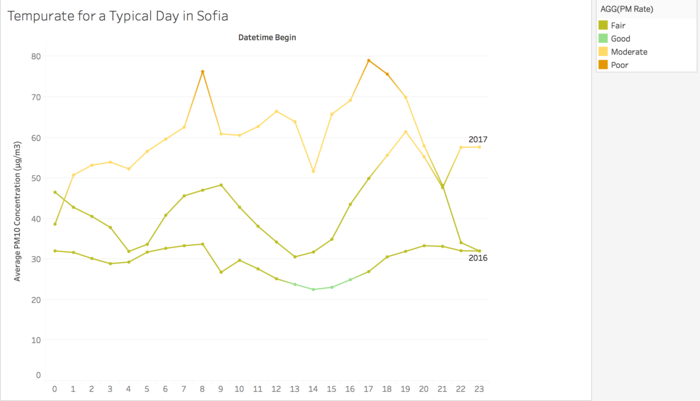
| + | A typical day in Sofia will have the following characteristics: <br /> | ||
| + | 0:00 - 4:00 : Low PM10 Concentration <br /> | ||
| + | 4:00 - 8:00 : Increase the PM10 Concentration and reaching the second highest daily peak around 8PM.<br /> | ||
| + | 8:00 - 14:00 : Decrease the PM10 COncentration and reaching the daily lowest around 2PM. <br /> | ||
| + | 14:00 - 18:00 / 19:00 : Increase the PM10 COncentration and reaching the daily peak around 6PM - 7PM. <br /> | ||
| + | After 18:00 / 19:00 : Decrease the PM10 COncentration. <br /> | ||
| + | This analysis cannot conclude the overall PM10 concentration at Sofia because it consolidates all months days. As mentioned above Sofia generally have a higher PM10 concentration from December to February. | ||
| + | <br/> | ||
| + | |} | ||
| + | |||
| + | {| class="wikitable" | ||
| + | |- | ||
| + | ! Anomalies find in the official air quality dataset | ||
| + | |- | ||
| + | | [[File:b2.2.png|700px|center]] | ||
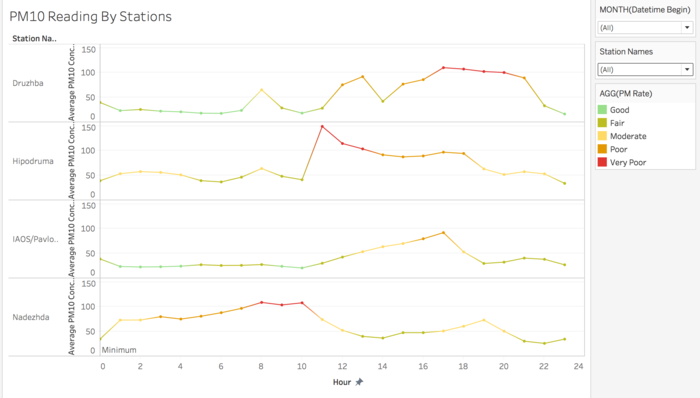
| + | By using 2016 as an example, we can observe from the above graph, each station have their peak PM10 reading different from others. And the timing occurs are slightly different from our typical day reading. This shows location is a critical consideration for PM10 measurement. <br /> | ||
| + | |||
| + | Other Observation includes: | ||
| + | 1. The incomplete of the dataset (i.e. 2017 only have data from late November and 2018 only have data till the middle of September), this result the inaccuracy average measurement on weekly and yearly PM10 concentration average. <br /> | ||
| + | 2. The only most completed full year data with the hourly record is 2016. However, 2016 alone is not very representative of the PM10 reading as we observe the reducing of PM10 from late 2017 onwards. The full year hourly data reading from 2018 will be more representative of the current Sofia data. <br /> | ||
| + | 3. There are 5 stations from 2013 - 2015, however a station (BG0054A / Orlov Most) was removed from 2016 - 2017, and a new station (BG0079A / Mladost) was added from 2018 onwards. Changing of the station will affect the overall reading because PM10 reading can be location sensitive, an average of 4 stations (2016-2017) might be losing the accuracy of the datapoints. <br /> | ||
| + | |||
| + | <br/> | ||
| + | |} | ||
===Task 2: Spatio-temporal Analysis of Citizen Science Air Quality Measurements=== | ===Task 2: Spatio-temporal Analysis of Citizen Science Air Quality Measurements=== | ||
| + | {| class="wikitable" | ||
| + | |- | ||
| + | ! Sensors’ coverage, performance and operation | ||
| + | |- | ||
| + | | [[File:b3.1.png|300px|center]] | ||
| + | |||
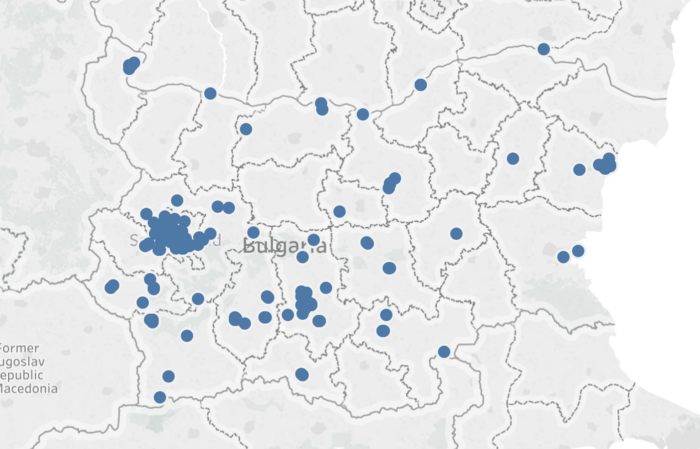
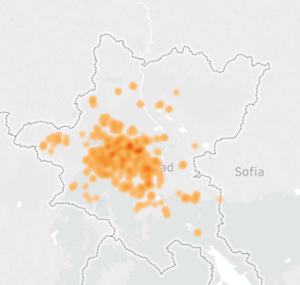
| + | By using the overall sensor location, we can observe that the sensor's coverage is more aggregated in the central to west part of Sofia. However, the sensor coverage is not covering the most south-east and north part. A possible reason would be those areas are with less human traffic. | ||
| + | |||
| + | [[File:b3.2.png|500px|center]] | ||
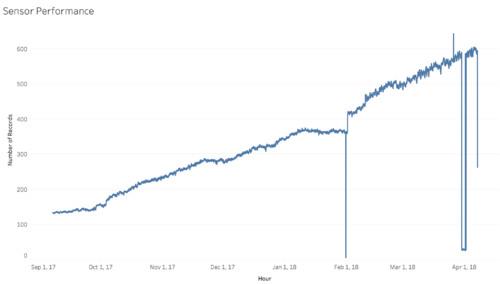
| + | Despite from September 2017 onwards, there is an increasing number of sensors to start functioning. But the sensors are not performing normal all the time. Especially, on 1st February 2018 and April 2018, there a few days with a huge drop in the number of records displayed the sensors are not functioning well in those days. | ||
| + | |||
| + | <br/> | ||
| + | |} | ||
| + | |||
| + | {| class="wikitable" | ||
| + | |- | ||
| + | ! Air pollution measurements with sensors | ||
| + | |- | ||
| + | | [[File:b3.3.png|400px|center]] | ||
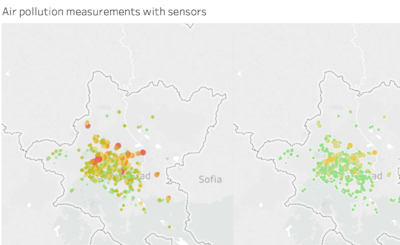
| + | Overall, the location with higher P1 and P1 concentration are more towards the center-north side of Sofia. | ||
| + | [[File:b3.4.png|400px|center]] | ||
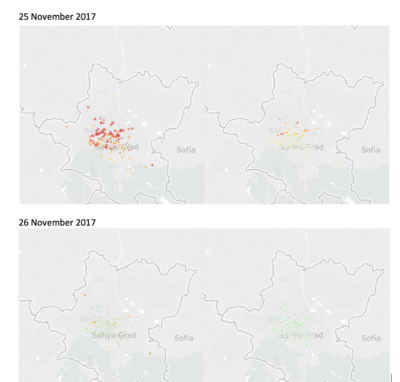
| + | The left graph displays the average daily reading for P1 and the right graph display the average daily reading for p2. From the above graph, we can inform that the change of air population is time sensitive. On 16 November 2017, the majority of the P1 reading is displayed as "Very Poor" as the red color. There is a dramatic change on the next day which the majority are clean indicating as "Good". | ||
| + | |||
| + | <br/> | ||
| + | |} | ||
| + | |||
| + | ===Task 3: Analysis factors affecting the Sofia Air Quality=== | ||
| + | |||
| + | {| class="wikitable" | ||
| + | |- | ||
| + | !Complex interactions between local topography and meteorological characteristics | ||
| + | |- | ||
| + | | [[File:4.1.png|700px|center]] <br /> | ||
| + | |||
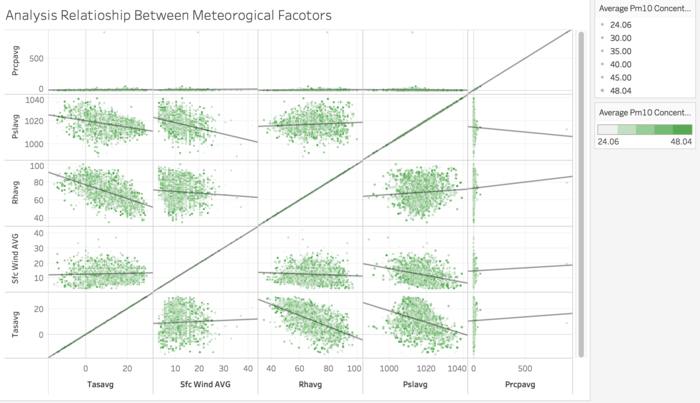
| + | Above graph display the relationship between meteorology factors and PM10 average concentration. We can clearly observe a certain relationship between those factors such as prcpabg have no major interaction with other factors, and Tasavg have a negative relationship with Rhavg and Pslavg. Future investigation needed to undercover the relationship between PM10 concentration and these meteorological factors.<br /> | ||
| + | |||
| + | |- | ||
| + | | [[File:4.2.png|700px|center]] | ||
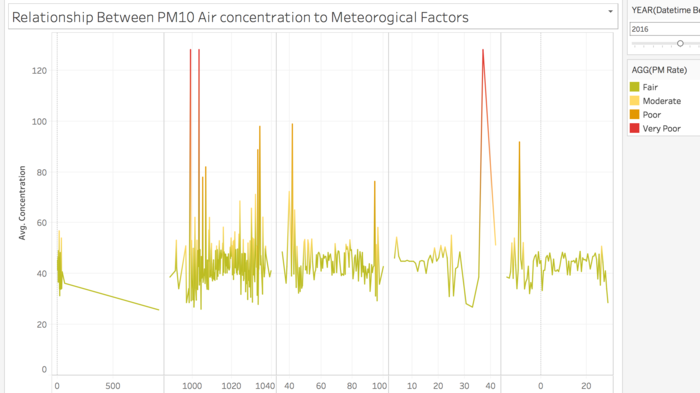
| + | From the above graph, we can easily identify the hourly measurement from 2016 onwards able to display a better relationship between PM10 air concentration and those meteorological factors. When Pslavg is the lowest, it is likely to have a higher concentration of PM10. When Stc Wind Avg have the highest record, it will likely to have a higher concentration of PM10. Furthermore, a low score of Tasavg might result in the high concentration of | ||
| + | PM10 too. | ||
| + | <br/> | ||
| + | |} | ||
| − | === | + | ==Final Dashboard== |
| + | The final dashboard can be retreive from the following link: <br /> | ||
| + | https://public.tableau.com/profile/zheng.bing.bing#!/vizhome/VAAssignment3_1/Story1 | ||
==References== | ==References== | ||
Latest revision as of 21:50, 12 November 2018
Contents
Background & Motivation
Air pollution is an important risk factor for health in Europe and worldwide. A recent review of the global burden of disease showed that it is one of the top ten risk factors for health globally. Worldwide an estimated 7 million people died prematurely because of pollution; in the European Union (EU) 400,000 people suffer a premature death. The Organisation for Economic Cooperation and Development (OECD) predicts that in 2050 outdoor air pollution will be the top cause of environmentally related deaths worldwide. In addition, air pollution has also been classified as the leading environmental cause of cancer.
"In Sofia, air pollution norms were exceeded 70 times in the heating period from October 2017 to March 2018, citizens’ initiative AirBG.info says. The day with the worst air pollution in Sofia was January 27, when the norm was exceeded six times over. Things got so out of control that even the European Court of Justice ruled against Bulgaria in a case brought by the European Commission against the country over its failure to implement measures to reduce air pollution. The two main reasons for the air pollution are believed to be solid fuel heating and motor vehicle traffic." -- Datathon
This project aims to create an interactive dashboard to examine the air quality in Sofia from the year 2013 to 14 Sept 2018.
PM Rate Classifcation Table (Europe)
Dataset Analysis & Transformation
Official air quality measurements
| Problem #1 | Data merging required for an easy process in the tableau. |
|---|---|
| Issue | Manual processing is not convenience to handle the larger number of records. An alternative method of merging data is required. |
| Solution |
Tableau Prep is using on merging of the data, it allows dynamic views of the output data records. And detecting any unusual behavior before making the visualizations.
|
| Problem #2 | Inconsistency of data record time |
|---|---|
| Issue | Year 2017 use data recording time as "2017-01-01 01:00:01", ending with ":01", which other records ended with ":00". |
| Solution |
Since we will only be using the hours as the measure, the last second will not have an effort on the result. Furthermore, all the DatatimeEnd are records ended with ":00" second. There is no action required.
|
| Problem #3 | Miss data points |
|---|---|
| Issue | The Year 2017 have a lot of months without datapoint, furthermore, the year 2018 only have the records till September 14. |
| Solution |
In order to have an overview of the air pollution in Sofia City, the data points from year 2017 and 2018 will keep for the analysis.
|
Citizen science air quality measurements (Airtube
| Problem #1 | Geohash required to be transferred into latlong |
|---|---|
| Issue | Tableau does not recognize Geohash code, a transformation of Geohash into latlong is required. |
| Solution |
By using the R file provided by Dr.KAM to transfer the geohash into latlong.
|
| Problem #2 | Records with sensor data outside of Sofia City |
|---|---|
| Issue | Points outside of the Sofia City region required to be removed. |
| Solution |
Those points will be excluded during the processing.
|
Detail Analysis
Task 1: Spatio-temporal Analysis of Official Air Quality
| Characterise the past and most recent situation with respect to air quality measures in Sofia City. |
|---|
|
A calendar chart is used to classify the Sofia city's both past and present air quality. The colour classification was followed by the UN Common Air Quality Index (CAQI) with the following setting: |
|
Majority of the weeks were classified as "Fair" in the past years. In recent years, more weeks that classified as "Fair" changed to "Good" condition. |
|
In the recent year 2018, the average weekly PM10 concentration has improved. More weeks are classified as "Good" condition which more less than 25 ug/m3. |
|
From the above graph, we can observe Sofia has its poorest air quality usually from December till February period. With the recent effort by reducing the PM10 population, we can see an effective reduction of the PM10 concentration on December 2017. There are no weeks classified as "Very Poor" in February 2018, which it does occur in the past years. Reducing the numbers of weeks that classified as "Very Poor" shows Sofia City is improving its air quality.
|
| A typical day in Sofia |
|---|
|
A typical day in Sofia will have the following characteristics: |
| Anomalies find in the official air quality dataset |
|---|
|
By using 2016 as an example, we can observe from the above graph, each station have their peak PM10 reading different from others. And the timing occurs are slightly different from our typical day reading. This shows location is a critical consideration for PM10 measurement. Other Observation includes:
1. The incomplete of the dataset (i.e. 2017 only have data from late November and 2018 only have data till the middle of September), this result the inaccuracy average measurement on weekly and yearly PM10 concentration average.
|
Task 2: Spatio-temporal Analysis of Citizen Science Air Quality Measurements
| Sensors’ coverage, performance and operation |
|---|
|
By using the overall sensor location, we can observe that the sensor's coverage is more aggregated in the central to west part of Sofia. However, the sensor coverage is not covering the most south-east and north part. A possible reason would be those areas are with less human traffic. Despite from September 2017 onwards, there is an increasing number of sensors to start functioning. But the sensors are not performing normal all the time. Especially, on 1st February 2018 and April 2018, there a few days with a huge drop in the number of records displayed the sensors are not functioning well in those days.
|
| Air pollution measurements with sensors |
|---|
|
Overall, the location with higher P1 and P1 concentration are more towards the center-north side of Sofia. The left graph displays the average daily reading for P1 and the right graph display the average daily reading for p2. From the above graph, we can inform that the change of air population is time sensitive. On 16 November 2017, the majority of the P1 reading is displayed as "Very Poor" as the red color. There is a dramatic change on the next day which the majority are clean indicating as "Good".
|
Task 3: Analysis factors affecting the Sofia Air Quality
| Complex interactions between local topography and meteorological characteristics |
|---|
| Above graph display the relationship between meteorology factors and PM10 average concentration. We can clearly observe a certain relationship between those factors such as prcpabg have no major interaction with other factors, and Tasavg have a negative relationship with Rhavg and Pslavg. Future investigation needed to undercover the relationship between PM10 concentration and these meteorological factors. |
|
From the above graph, we can easily identify the hourly measurement from 2016 onwards able to display a better relationship between PM10 air concentration and those meteorological factors. When Pslavg is the lowest, it is likely to have a higher concentration of PM10. When Stc Wind Avg have the highest record, it will likely to have a higher concentration of PM10. Furthermore, a low score of Tasavg might result in the high concentration of
PM10 too.
|
Final Dashboard
The final dashboard can be retreive from the following link:
https://public.tableau.com/profile/zheng.bing.bing#!/vizhome/VAAssignment3_1/Story1
References
[1] Datathon Air Sofia Case : https://www.datasciencesociety.net/the-telelink-case-one-step-closer-to-a-better-air-quality-and-city/
[2] Tableau Training Library : https://www.tableau.com/learn/training
[3] Air quality index : https://en.wikipedia.org/wiki/Air_quality_index
