Difference between revisions of "IS428 AY2018-19T1 Kim Do Yeon"
m |
|||
| (2 intermediate revisions by the same user not shown) | |||
| Line 25: | Line 25: | ||
{| class="wikitable" | {| class="wikitable" | ||
|- | |- | ||
| − | ! style="font-weight: bold;background: #008080;color:#FFFFFF;width: 20%;" | | + | ! style="font-weight: bold;background: #008080;color:#FFFFFF;width: 20%;" | Interactivity |
| − | ! style="font-weight: bold;background: #008080;color:#FFFFFF;width: 40%" | | + | ! style="font-weight: bold;background: #008080;color:#FFFFFF;width: 40%" | Purpose |
| − | ! style="font-weight: bold;background: #008080;color:#FFFFFF;" | | + | ! style="font-weight: bold;background: #008080;color:#FFFFFF;" | Steps |
|- | |- | ||
| <center>'''Highlight the Region to observe the daily data of the air quality''' <br/></center> | | <center>'''Highlight the Region to observe the daily data of the air quality''' <br/></center> | ||
| Line 89: | Line 89: | ||
[[File:V1.8.png|thumb|600px|center]] | [[File:V1.8.png|thumb|600px|center]] | ||
<p>2017 data set only consists of only November to December data. The sensors did not seem to work until end of the November or the data is missing from January to end of the November. This may affect the overall average results from 2013 to 2018.The average value from January to November will not be included. However, the main objective of the function is to see the PM10 concentration over the typical days. The average values will not significantly affect the PM10 concentration over the typical days. Therefore, the data 2017 data set can be included.</p> | <p>2017 data set only consists of only November to December data. The sensors did not seem to work until end of the November or the data is missing from January to end of the November. This may affect the overall average results from 2013 to 2018.The average value from January to November will not be included. However, the main objective of the function is to see the PM10 concentration over the typical days. The average values will not significantly affect the PM10 concentration over the typical days. Therefore, the data 2017 data set can be included.</p> | ||
| + | |||
| + | ==Link== | ||
| + | *Daily:https://public.tableau.com/views/Task1_final_0/Spatio-temporalAnalysisofOfficialAirQualityDaily?:embed=y&:display_count=yes | ||
| + | *hourly:https://public.tableau.com/views/HourlyPM10Concentration/Spatio-temporalAnalysisofOfficialAirQualityHourly?:embed=y&:display_count=yes&publish=yes | ||
==Visualisation 2 ( Spatio-temporal Analysis of Citizen Science Air Quality Measurements)== | ==Visualisation 2 ( Spatio-temporal Analysis of Citizen Science Air Quality Measurements)== | ||
| Line 94: | Line 98: | ||
===Data preparation=== | ===Data preparation=== | ||
In Air tube zip file, there are two csv files. Sensors recorded temperature, humidity and pressure from 2017 to 2018. The Geohash is converted to longitude and latitude using R code(geohash library and “gh_decode()” function was used).After converting the geohash to longitude and latitude, the data frame of 2017,2018 were merged and its respective longitude and latitude were concatenated. | In Air tube zip file, there are two csv files. Sensors recorded temperature, humidity and pressure from 2017 to 2018. The Geohash is converted to longitude and latitude using R code(geohash library and “gh_decode()” function was used).After converting the geohash to longitude and latitude, the data frame of 2017,2018 were merged and its respective longitude and latitude were concatenated. | ||
| − | + | [[File:V2.1.png|thumb|600px|center]] | |
This shows the data frame concatenated with original csv file with its respective latitude and longitude. | This shows the data frame concatenated with original csv file with its respective latitude and longitude. | ||
===Observations=== | ===Observations=== | ||
| + | [[File:V2.2.png|thumb|600px|center]] | ||
<p>By using the merged dataset in the Air tube.zip file, density map can be plotted using “density” at marks. Generally, the sensors were spread all over the country and all the states. However, the main function of the visualisation is to show the Air pollution in Sofia city. After zooming in to the Sofia city, it can be seen that the sensors are focused at the central part of the Sofia city and they are not well distributed at the northern and southern part of the Sofia city. Overall, sensors are not well distributed over the entire city</p> | <p>By using the merged dataset in the Air tube.zip file, density map can be plotted using “density” at marks. Generally, the sensors were spread all over the country and all the states. However, the main function of the visualisation is to show the Air pollution in Sofia city. After zooming in to the Sofia city, it can be seen that the sensors are focused at the central part of the Sofia city and they are not well distributed at the northern and southern part of the Sofia city. Overall, sensors are not well distributed over the entire city</p> | ||
| + | [[File:V2.3.png|thumb|600px|center]] | ||
{| class="wikitable" | {| class="wikitable" | ||
|- | |- | ||
| − | ! style="font-weight: bold;background: #008080;color:#FFFFFF;width: 20%;" | | + | ! style="font-weight: bold;background: #008080;color:#FFFFFF;width: 20%;" |Interactiity |
| − | !! style="font-weight: bold;background: #008080;color:#FFFFFF;width: 20%;" | | + | !! style="font-weight: bold;background: #008080;color:#FFFFFF;width: 20%;" |Purpose |
| − | !! style="font-weight: bold;background: #008080;color:#FFFFFF;width: 20%;" | | + | !! style="font-weight: bold;background: #008080;color:#FFFFFF;width: 20%;" |Steps |
|- | |- | ||
| '''Highlight the place to observe the daily data of the air quality''' || It is to show the air quality in different place of sensors and its trend over the Months || | | '''Highlight the place to observe the daily data of the air quality''' || It is to show the air quality in different place of sensors and its trend over the Months || | ||
| Line 113: | Line 119: | ||
# Change the filter to be shown as slider | # Change the filter to be shown as slider | ||
|} | |} | ||
| + | [[File:V2.4.png|thumb|600px|center]] | ||
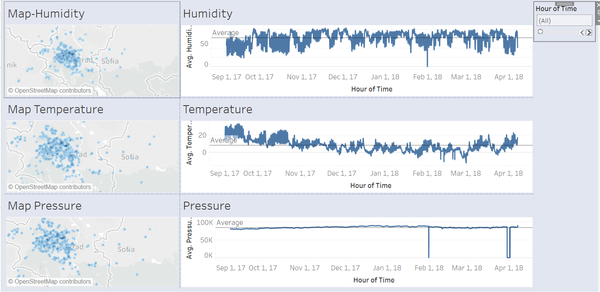
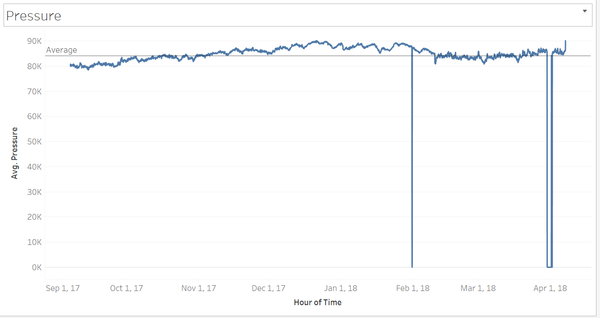
<p>sensors have detected humidity, temperature and pressure as well. Here are the following Observations below. From the dashboard above, we can observe the days that sensors were inactive. On Jan 31st, Sensor did not record the humidity data as it is shown as 0 from the data. This applies to pressure as it is indicated as 0 from the graph. For temperature, it is difficult to observe from the line graph as temperature can be 0 degrees. Thus, there is a possibility that the sensor did not function on 31st of the January 2018.Morever, the sensor did not seem to work on March 30th to 1st April 2018.However, the sensor worked properly for most of the days.</p> | <p>sensors have detected humidity, temperature and pressure as well. Here are the following Observations below. From the dashboard above, we can observe the days that sensors were inactive. On Jan 31st, Sensor did not record the humidity data as it is shown as 0 from the data. This applies to pressure as it is indicated as 0 from the graph. For temperature, it is difficult to observe from the line graph as temperature can be 0 degrees. Thus, there is a possibility that the sensor did not function on 31st of the January 2018.Morever, the sensor did not seem to work on March 30th to 1st April 2018.However, the sensor worked properly for most of the days.</p> | ||
| Line 134: | Line 141: | ||
|} | |} | ||
| + | [[File:V2.5.png|thumb|600px|center]] | ||
===Air pollution measurement=== | ===Air pollution measurement=== | ||
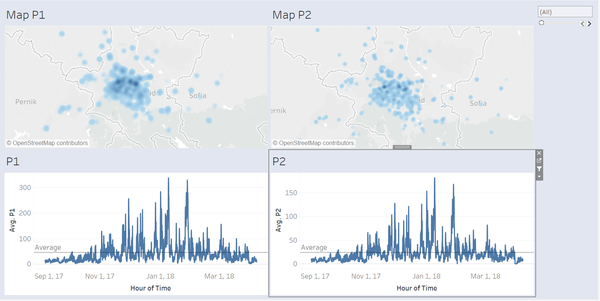
<p>To understand the measurement of the air pollution, p1 and p2 data is used. By observing the heatmap above, the central region of the Sofia city has a darker colour. This implies that the air pollution at central Sofia is higher than the other regions in Sofia city. This is possibly due to high influx of people to the centre of the city. It also shows that air pollution is time dependent. The air pollution generally starts to increase from November to February and then it decreases. This implies that the air pollution gets worse at the end of the year.</p> | <p>To understand the measurement of the air pollution, p1 and p2 data is used. By observing the heatmap above, the central region of the Sofia city has a darker colour. This implies that the air pollution at central Sofia is higher than the other regions in Sofia city. This is possibly due to high influx of people to the centre of the city. It also shows that air pollution is time dependent. The air pollution generally starts to increase from November to February and then it decreases. This implies that the air pollution gets worse at the end of the year.</p> | ||
| − | + | [[File:V2.6.png|thumb|600px|center]] | |
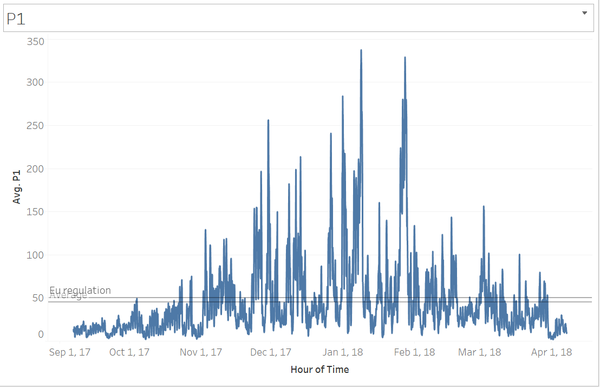
<p>P1, the air concentration starts to exceed to EU regulation (50 micro grams per cube metres) and then it drastically increases from November to February reaching 334.5 micro grams per cube metre on January 8th.Then after February the concentration generally decreases.</p> | <p>P1, the air concentration starts to exceed to EU regulation (50 micro grams per cube metres) and then it drastically increases from November to February reaching 334.5 micro grams per cube metre on January 8th.Then after February the concentration generally decreases.</p> | ||
| − | + | [[File:V2.7.png|thumb|600px|center]] | |
<p>Similarly, the air pollution concentration starts to increase from November to February reaching peak of 181.4 micro grams per cube metres on January 8th.The difference between P1 and P2 is that the average concentration of the air pollutants is lower for P2. </p> | <p>Similarly, the air pollution concentration starts to increase from November to February reaching peak of 181.4 micro grams per cube metres on January 8th.The difference between P1 and P2 is that the average concentration of the air pollutants is lower for P2. </p> | ||
| + | ==Link== | ||
| + | *p1&p2:https://public.tableau.com/shared/5KMTNS85P?:display_count=yes | ||
| + | *Temp,Humidity,Pressure:https://public.tableau.com/views/TemperatureHumidity/HumidityTemperatureandPressure?:embed=y&:display_count=yes&publish=yes | ||
==Visualisation 3 (Factors affecting the air quality of the city)== | ==Visualisation 3 (Factors affecting the air quality of the city)== | ||
| Line 151: | Line 162: | ||
*Longitude: 23.3829 | *Longitude: 23.3829 | ||
*Elevation: 595 m | *Elevation: 595 m | ||
| + | [[File:V3.1.png|thumb|600px|center]] | ||
By comparing the latitude and altitude given in the TOPO data, there is no exact match of the region. However, by comparing with the longitude and latitude given in metadata (EEA DATA for task 1), we can find that the Latitude and Longitude of the Sofia airport is approximately same as Mladost region. Here we can link the daily PM10 concentration in 2018 to factors given in Meteorological data. | By comparing the latitude and altitude given in the TOPO data, there is no exact match of the region. However, by comparing with the longitude and latitude given in metadata (EEA DATA for task 1), we can find that the Latitude and Longitude of the Sofia airport is approximately same as Mladost region. Here we can link the daily PM10 concentration in 2018 to factors given in Meteorological data. | ||
| + | [[File:V3.2.png|thumb|600px|center]] | ||
| + | Python script to obatin average PM10 concentration per day | ||
| + | [[File:V3.3.png|thumb|600px|center]] | ||
<p>By running this script, the average PM10 concentration of the day can be obtained for 2018.Then it can be innerjoined to show the PM10 concentration on the day recoreded in Meteo CSV. This enables comparison of air pollution and Meteo factors.</p> | <p>By running this script, the average PM10 concentration of the day can be obtained for 2018.Then it can be innerjoined to show the PM10 concentration on the day recoreded in Meteo CSV. This enables comparison of air pollution and Meteo factors.</p> | ||
| + | [[File:V3.4.png|thumb|600px|center]] | ||
| + | |||
{| class="wikitable" | {| class="wikitable" | ||
|- | |- | ||
| − | ! style="font-weight: bold;background: #008080;color:#FFFFFF;width: 20%;" | | + | ! style="font-weight: bold;background: #008080;color:#FFFFFF;width: 20%;" |Interactivity !! style="font-weight: bold;background: #008080;color:#FFFFFF;width: 20%;" |Purpose |
| − | !! style="font-weight: bold;background: #008080;color:#FFFFFF;width: 20%;" | | + | !! style="font-weight: bold;background: #008080;color:#FFFFFF;width: 20%;" |Steps |
|- | |- | ||
| '''Filter by the Month of Date to find the relationship between factors and PM 10 concentration''' ||It is to show the air quality and meteorological factors in different months|| | | '''Filter by the Month of Date to find the relationship between factors and PM 10 concentration''' ||It is to show the air quality and meteorological factors in different months|| | ||
| Line 186: | Line 203: | ||
| <center>'''Pressure'''</center> || Pressure does not seem to be related to the PM10 concentration | | <center>'''Pressure'''</center> || Pressure does not seem to be related to the PM10 concentration | ||
|} | |} | ||
| − | |||
===Possible Factors=== | ===Possible Factors=== | ||
<p>In conclusion, the factors that affect PM 10 concentration are Wind Speed and Temperature. Other than such meteorological factors, I believe that transportation is also another factor causing the high PM10 concentration in Sofia city. As aforementioned in task1, the concention drastically increases before working hours and after working hours.Moreover, the air concentration is higher at the end and start of the year. All these can cause high influx in population. This means that there will be more number of cars coming in and out from the central region. The more the care, the higher the emission of the gas. Thus, contributing to higher concentration of the PM10.</p> | <p>In conclusion, the factors that affect PM 10 concentration are Wind Speed and Temperature. Other than such meteorological factors, I believe that transportation is also another factor causing the high PM10 concentration in Sofia city. As aforementioned in task1, the concention drastically increases before working hours and after working hours.Moreover, the air concentration is higher at the end and start of the year. All these can cause high influx in population. This means that there will be more number of cars coming in and out from the central region. The more the care, the higher the emission of the gas. Thus, contributing to higher concentration of the PM10.</p> | ||
| − | + | ==Link== | |
| + | *Factors:https://public.tableau.com/views/Task3_final/Comparison?:embed=y&:display_count=yes&publish=yes | ||
== References == | == References == | ||
Latest revision as of 00:39, 12 November 2018
Contents
Problem
Air quality in Bulgaria is now a big concern. The Air quality has been measured every day to keep track of and detect whether the air in Bulgaria is detrimental to people’s health. According to the World Health Organisation, Bulgaria had the highest PM2.5 concentrations of all EU -28-member states in urban areas over the three years average. For PM10, Bulgaria is one of the top countries with 77 micrograms per cube metre (EU limit is 50 micrograms per cube metre). With the large sets of data collected from the sensor, the PM 10 air quality and its factors can be measured. Here, data visualisation will aid in finding the patterns of air quality in Sofia city as well as to identify the issues and factors of air pollution. The interactive visualisation has three functions
- 1) Patterns of air quality in Sofia city from 2013 to 2018 on a daily and hourly basis
- 2) Showing the pattern of the data (Temperature, Humidity, Pressure) collected from the sensor.
- 3) Compare the air pressure and meteorology of Sofia City. Reveal the relationships between the factors causing air quality in Sofia City
Visualisation 1( Spatio-temporal Analysis of Official Air Quality)
Data Preparation
For the task, 4 major data sets were in zipped file format and were provided and for visualisation 1, EEA Data.zip was used. First zipped file (EEA Data.zip) had official air quality measurements from 2013 to 2018 from 5 different regions. Before using all the data, some of the files were not included in the visualisation.
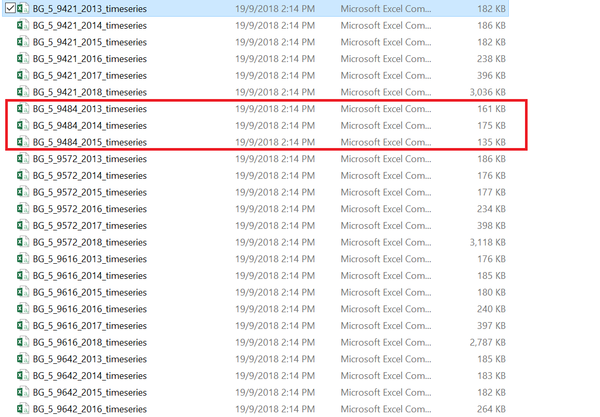
There are only 3 data sets(2013-2015) for the region code 9484.It excludes this data set as we cannot characterise past and most recent situation. The data observed in region 9484 is not big enough to deliver the pattern from 2013 to 2018 when the visualisation is done. It will not show the right patterns of the air quality as data from 2016 to 2018 is missing.
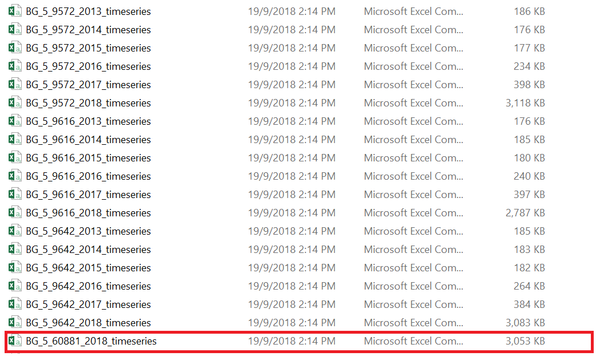
For this data “BG_5_60881_2018_timeseries.csv” has only one set of data which is only on 2018. However, this dataset can be used as the measurement of the air quality from 2013-2017 is different from 2018. This dataset will be used to compare the daily pattern of the air quality in 2018 over the 5 regions.
In the same zip file (EEA DATA.zip), there is also an additional data “metadata.csv”. It is as shown above. This meta data shows the Longitude, Latitude and the Altitude of the Measurement place and this data can be also concatenated to the timeseries data set. Therefore, all the timeseries data frame is merged and concatenated with the metadata. Each sampling region now have its respective longitude, latitude, altitude and common name. With concatenating the data, geographical features can be also shown.
Observations
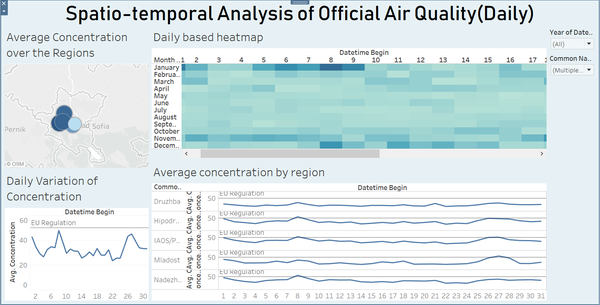
From the merged data set, Datetimebegin data from 2013-2016 is daily basis while from 2017-2018 is hourly basis data. To show what typical day looks like for Sofia city, both daily and hourly based visualisation are used.
| Interactivity | Purpose | Steps |
|---|---|---|
| ||
|
Typical Day for Sofia city
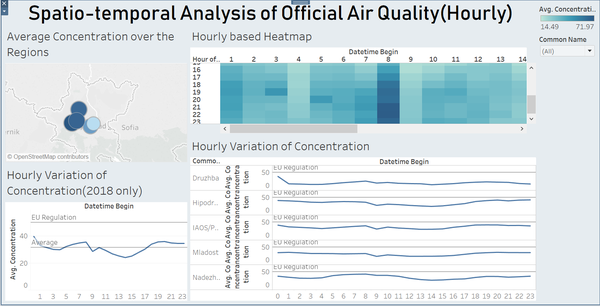
Initially, Typical day here is interpreted as air quality on daily basis and hourly basis. From the data set given by the sensor, the hourly basis air quality could be only observed in 2018 for all 5 regions. The hourly sensor has collected data for 24 hours.
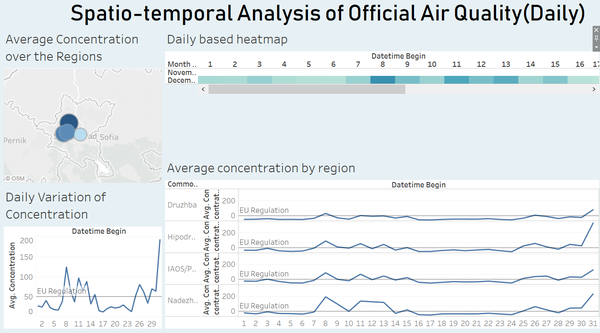
- Over the Years, the PM10 concentration was higher than other days from January 1st to January 9th.One possible reason maybe high influx of people in Sofia city during New Year. High influx of the people may result in huge amount of gas emissions (cars etc).
- Over the Months, PM10 concentration was generally high in the first weekend of the month and last few days of the month. This means that the emission was generally high in the start and end of the month.
- Over the days, PM 10 concentration was high reaching approximately 31.63 micro grams per cube metres, but it was still under the amount of the EU regulation (50 micro grams)
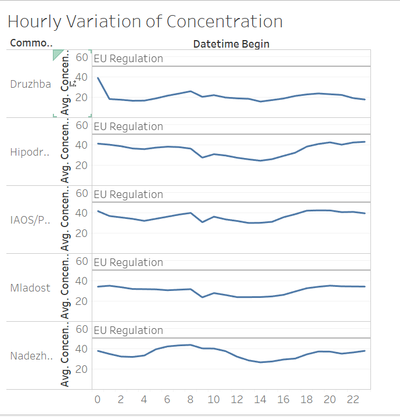
- Over the days, PM 10 concentration is higher than average from 5pm to 2 am and 5 am to 9 am. The Pm 10 concentrations generally decrease from 9 am to 5 pm. This possibly means the PM10 concentration increases before and working time. Thus, it might be the transportation such as cars and buses that causes the air pollution.
The following table also explores the difference of PM 10 concentration in different regions. For typical day (hourly basis), only 2018 data set has been used to compare the all 5 regions.
| Region | Observations |
|---|---|
| |
| |
| |
| |
|
To summarise, the interesting possible trend is that the PM10 concentration is generally higher at the start and the end of the day. This may be due to influx of people going to work/home from other regions. Transportation like cars, buses and train can emit gases that increases PM10 concentration. Therefore, the concentration is higher before working hours (8am) and after working hours(4~6pm).
Anomalies in Dataset
2017 data set only consists of only November to December data. The sensors did not seem to work until end of the November or the data is missing from January to end of the November. This may affect the overall average results from 2013 to 2018.The average value from January to November will not be included. However, the main objective of the function is to see the PM10 concentration over the typical days. The average values will not significantly affect the PM10 concentration over the typical days. Therefore, the data 2017 data set can be included.
Link
- Daily:https://public.tableau.com/views/Task1_final_0/Spatio-temporalAnalysisofOfficialAirQualityDaily?:embed=y&:display_count=yes
- hourly:https://public.tableau.com/views/HourlyPM10Concentration/Spatio-temporalAnalysisofOfficialAirQualityHourly?:embed=y&:display_count=yes&publish=yes
Visualisation 2 ( Spatio-temporal Analysis of Citizen Science Air Quality Measurements)
Data preparation
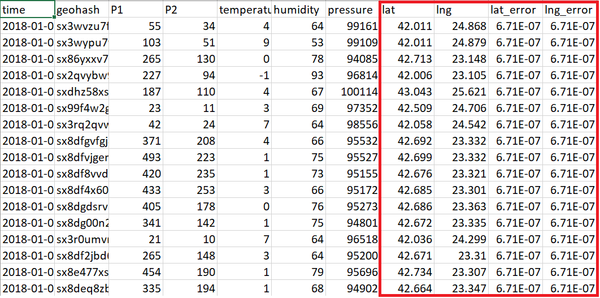
In Air tube zip file, there are two csv files. Sensors recorded temperature, humidity and pressure from 2017 to 2018. The Geohash is converted to longitude and latitude using R code(geohash library and “gh_decode()” function was used).After converting the geohash to longitude and latitude, the data frame of 2017,2018 were merged and its respective longitude and latitude were concatenated.
This shows the data frame concatenated with original csv file with its respective latitude and longitude.
Observations
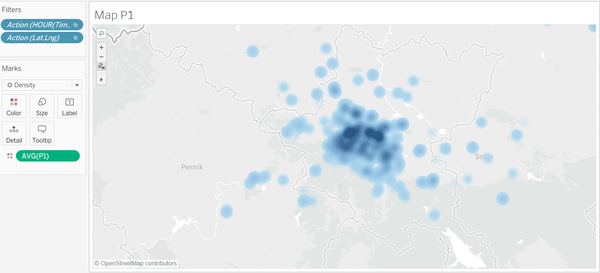
By using the merged dataset in the Air tube.zip file, density map can be plotted using “density” at marks. Generally, the sensors were spread all over the country and all the states. However, the main function of the visualisation is to show the Air pollution in Sofia city. After zooming in to the Sofia city, it can be seen that the sensors are focused at the central part of the Sofia city and they are not well distributed at the northern and southern part of the Sofia city. Overall, sensors are not well distributed over the entire city
| Interactiity | Purpose | Steps |
|---|---|---|
| Highlight the place to observe the daily data of the air quality | It is to show the air quality in different place of sensors and its trend over the Months |
|
| Highlight the values for the specific hours of the time | Show the different values of the humidity, temperature pressure based on different hours. |
|
sensors have detected humidity, temperature and pressure as well. Here are the following Observations below. From the dashboard above, we can observe the days that sensors were inactive. On Jan 31st, Sensor did not record the humidity data as it is shown as 0 from the data. This applies to pressure as it is indicated as 0 from the graph. For temperature, it is difficult to observe from the line graph as temperature can be 0 degrees. Thus, there is a possibility that the sensor did not function on 31st of the January 2018.Morever, the sensor did not seem to work on March 30th to 1st April 2018.However, the sensor worked properly for most of the days.
| Type | Observations |
|---|---|
| |
| |
|
Air pollution measurement
To understand the measurement of the air pollution, p1 and p2 data is used. By observing the heatmap above, the central region of the Sofia city has a darker colour. This implies that the air pollution at central Sofia is higher than the other regions in Sofia city. This is possibly due to high influx of people to the centre of the city. It also shows that air pollution is time dependent. The air pollution generally starts to increase from November to February and then it decreases. This implies that the air pollution gets worse at the end of the year.
P1, the air concentration starts to exceed to EU regulation (50 micro grams per cube metres) and then it drastically increases from November to February reaching 334.5 micro grams per cube metre on January 8th.Then after February the concentration generally decreases.
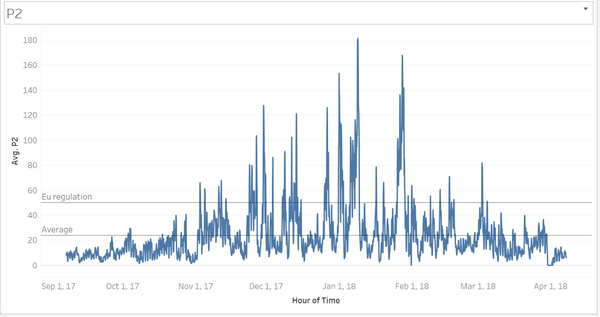
Similarly, the air pollution concentration starts to increase from November to February reaching peak of 181.4 micro grams per cube metres on January 8th.The difference between P1 and P2 is that the average concentration of the air pollutants is lower for P2.
Link
- p1&p2:https://public.tableau.com/shared/5KMTNS85P?:display_count=yes
- Temp,Humidity,Pressure:https://public.tableau.com/views/TemperatureHumidity/HumidityTemperatureandPressure?:embed=y&:display_count=yes&publish=yes
Visualisation 3 (Factors affecting the air quality of the city)
Data preparation
From Meteorological Data readings, we can get the latitude and the longitude of the Sofia Airport
- Latitude: 42.6537
- Longitude: 23.3829
- Elevation: 595 m
By comparing the latitude and altitude given in the TOPO data, there is no exact match of the region. However, by comparing with the longitude and latitude given in metadata (EEA DATA for task 1), we can find that the Latitude and Longitude of the Sofia airport is approximately same as Mladost region. Here we can link the daily PM10 concentration in 2018 to factors given in Meteorological data.
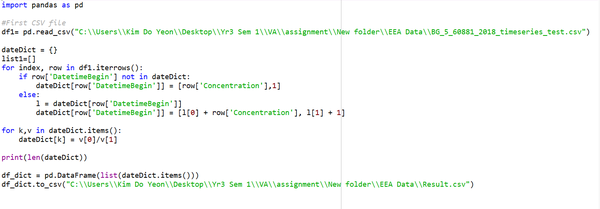
Python script to obatin average PM10 concentration per day
By running this script, the average PM10 concentration of the day can be obtained for 2018.Then it can be innerjoined to show the PM10 concentration on the day recoreded in Meteo CSV. This enables comparison of air pollution and Meteo factors.
| Interactivity | Purpose | Steps |
|---|---|---|
| Filter by the Month of Date to find the relationship between factors and PM 10 concentration | It is to show the air quality and meteorological factors in different months |
|
Observations
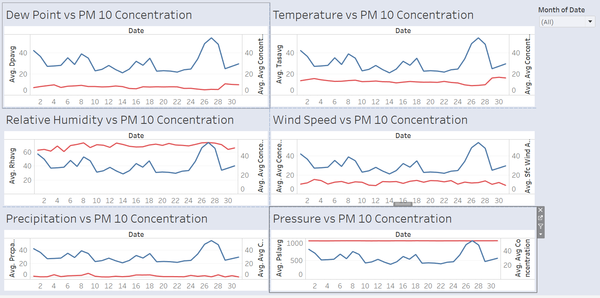
For Local Topography and referring to the TOPO data, Sofia Airport is same as the Mladost from task1. Therefore, the PM10 concentration value from Mladost is being used together with the meteorology factors. Here, the dashboard explores all the relationship between the PM10 concentration and meteorological factors.
| Factors(vs PM10 concentration | Observation |
|---|---|
| Dew point does not seem directly related to PM 10 concentration. | |
| Temperature seems indirectly related to the PM Concentration. The valure of PM 10 concentration is high when the temperature is low. | |
| Relative humiditiy does not seem to have direct relationship with the PM10 concentration | |
| Wind Speed seems indirectly related to the PM 10 concentration. This is because when the wind speed is low the PM10 concentration tends to be higher. | |
| Precipitation does not seem to be related to the PM 10 concentration | |
| Pressure does not seem to be related to the PM10 concentration |
Possible Factors
In conclusion, the factors that affect PM 10 concentration are Wind Speed and Temperature. Other than such meteorological factors, I believe that transportation is also another factor causing the high PM10 concentration in Sofia city. As aforementioned in task1, the concention drastically increases before working hours and after working hours.Moreover, the air concentration is higher at the end and start of the year. All these can cause high influx in population. This means that there will be more number of cars coming in and out from the central region. The more the care, the higher the emission of the gas. Thus, contributing to higher concentration of the PM10.
Link
- Factors:https://public.tableau.com/views/Task3_final/Comparison?:embed=y&:display_count=yes&publish=yes
References
- Meteological factors -Article(https://www.qld.gov.au/environment/pollution/monitoring/air/air-monitoring/meteorology-influence/meteorology-factors)
- Tableau-Density heatmap(https://onlinehelp.tableau.com/current/pro/desktop/en-us/buildexamples_density.htm)
