Difference between revisions of "IS428 AY2018-19T1 Zheng Bingbing"
Bbzheng.2015 (talk | contribs) |
Bbzheng.2015 (talk | contribs) |
||
| Line 18: | Line 18: | ||
|- | |- | ||
| Solution || | | Solution || | ||
| − | [[File:dataclean1.png|700px|center]] | + | [[File:dataclean1.png.png|700px|center]] |
Tableau Prep is using on merging of the data, it allows dynamic views of the output data records. And detecting any unusual behavior before making the visualizations. | Tableau Prep is using on merging of the data, it allows dynamic views of the output data records. And detecting any unusual behavior before making the visualizations. | ||
<br/> | <br/> | ||
Revision as of 00:02, 12 November 2018
Contents
Background & Motivation
Air pollution is an important risk factor for health in Europe and worldwide. A recent review of the global burden of disease showed that it is one of the top ten risk factors for health globally. Worldwide an estimated 7 million people died prematurely because of pollution; in the European Union (EU) 400,000 people suffer a premature death. The Organisation for Economic Cooperation and Development (OECD) predicts that in 2050 outdoor air pollution will be the top cause of environmentally related deaths worldwide. In addition, air pollution has also been classified as the leading environmental cause of cancer.
"In Sofia, air pollution norms were exceeded 70 times in the heating period from October 2017 to March 2018, citizens’ initiative AirBG.info says. The day with the worst air pollution in Sofia was January 27, when the norm was exceeded six times over. Things got so out of control that even the European Court of Justice ruled against Bulgaria in a case brought by the European Commission against the country over its failure to implement measures to reduce air pollution. The two main reasons for the air pollution are believed to be solid fuel heating and motor vehicle traffic." -- Datathon
This project aims to create an interactive dashboard to examine the air quality in Sofia from the year 2013 to 14 Sept 2018.
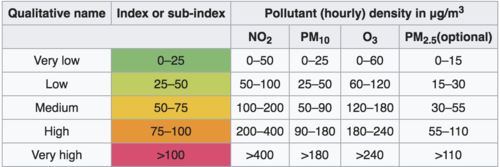
PM Rate Classifcation Table (Europe)
Dataset Analysis & Transformation
Official air quality measurements
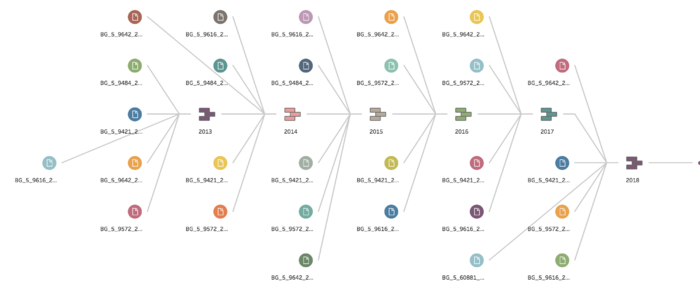
| Problem #1 | Data merging required for an easy process in the tableau. |
|---|---|
| Issue | Manual processing in not convenience in handling the larger number of records. An alternative method of merging data is required. |
| Solution |
Tableau Prep is using on merging of the data, it allows dynamic views of the output data records. And detecting any unusual behavior before making the visualizations.
|
Interactive Dashboard Design
Detail Analysis
Task 1: Spatio-temporal Analysis of Official Air Quality
Task 2: Spatio-temporal Analysis of Citizen Science Air Quality Measurements
Task 3:
References
[1] Datathon Air Sofia Case : https://www.datasciencesociety.net/the-telelink-case-one-step-closer-to-a-better-air-quality-and-city/
[2] Tableau Training Library : https://www.tableau.com/learn/training
[3] Air quality index : https://en.wikipedia.org/wiki/Air_quality_index

