Difference between revisions of "IS428 AY2018-19T1 Tian Seet Yuen"
Sytian.2016 (talk | contribs) |
Sytian.2016 (talk | contribs) |
||
| Line 57: | Line 57: | ||
| Issue || In the datasets, 11-character geohash was used to provide geographical details. However, Tableau is unable to read these values. | | Issue || In the datasets, 11-character geohash was used to provide geographical details. However, Tableau is unable to read these values. | ||
|- | |- | ||
| − | | Solution || R Notebook was utilized to generate the latitude and longitude values according to these geohash values. | + | | Solution || R Notebook was utilized to generate the latitude and longitude values according to these geohash values. After which, these values were combined to the current dataset as new columns. |
[[File:R geo decode.png|thumb|center]] | [[File:R geo decode.png|thumb|center]] | ||
|} | |} | ||
Revision as of 02:17, 9 November 2018
Contents
Problem & Motivation
Air pollution is an important risk factor for health in Europe and worldwide. A recent review of the global burden of disease showed that it is one of the top ten risk factors for health globally. Worldwide an estimated 7 million people died prematurely because of pollution; in the European Union (EU) 400,000 people suffer a premature death. The Organisation for Economic Cooperation and Development (OECD) predicts that in 2050 outdoor air pollution will be the top cause of environmentally related deaths worldwide. In addition, air pollution has also been classified as the leading environmental cause of cancer.
Air quality in Bulgaria is a big concern: measurements show that citizens all over the country breathe in air that is considered harmful to health. For example, concentrations of PM2.5 and PM10 are much higher than what the EU and the World Health Organization (WHO) have set to protect health.
Bulgaria had the highest PM2.5 concentrations of all EU-28 member states in urban areas over a three-year average. For PM10, Bulgaria is also leading on the top polluted countries with 77 μg/m3on the daily mean concentration (EU limit value is 50 μg/m3).
According to the WHO, 60 percent of the urban population in Bulgaria is exposed to dangerous (unhealthy) levels of particulate matter (PM10).
Exploratory Data Analysis & Transformation Process
Before proceeding to Exploratory Data Analysis (EDA), the datasets given need to be cleaned and transformed. In total, there were 4 zipped files, each with a different purpose. This section seeks to provide elaboration on the EDA and data transformation process.
EEA Data
Firstly, let's look at the Official Air Quality data. According to the metadata, there are 6 stations - Nadezhda, Hipodruma, Druzhba, Orlov Most, IAOS/Pavlovo and Mladost. All datasets were merged together into a single csv file.
The important variables are as follow:
- AirQualityStationEoICode
- CommonName
- AirPollutant
- AveragingTime
- Concentration
- DateTime
- Longitude
- Latitude
| Problem #1 | Missing Values |
|---|---|
| Issue | Upon further inspection, data for Year 2016 - 2018 were missing for Orlov Most station, and data for Year 2013 - 2017 were missing for Mladost. Meanwhile, data from Jan 2017 to Oct 2017 were missing for all stations. |
| Solution | Since the main goal is to visualize the overall characteristics of air quality in Sofia City, Orlov Most station was excluded completely since most of its data is missing. However, the remaining stations remained included in the EDA process to discover potential patterns and insights. |
| Problem #2 | Different AveragingTime formats |
|---|---|
| Issue | In this set of timeseries data, there appears to be different AveragingTime formats of PM10 concentration values. In total, there are 3 different formats - 1. Day 2. Var 3. Hour. To illustrate, data for Year 2016 - 2018 are mostly recorded in Hour or Var format. |
| Solution | The datasets will be separated into two formats: Daily and Hourly. Firstly, Var values were converted to Hour values by deducting 1 hour from the Var values. Next, to convert Hour values to Day values, the mean for Hour values in each Day was computed. With that, we have two sets of data - Daily and Hourly. |
Air Tube
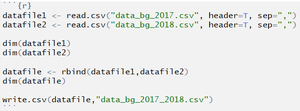
Next, let's explore the Citizen science Air Quality measurements. Firstly, there were 2 datasets - one for 2017 and another for 2018. After which, both datasets were combined together, via a notebook written in R.
| Problem #1 | Tableau unable to read 11-character Geohash values |
|---|---|
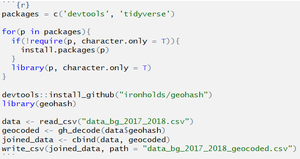
| Issue | In the datasets, 11-character geohash was used to provide geographical details. However, Tableau is unable to read these values. |
| Solution | R Notebook was utilized to generate the latitude and longitude values according to these geohash values. After which, these values were combined to the current dataset as new columns. |
Dataset Import Structure & Process
Interactive Visualisation
Interesting & Anomalous Observations
References

