Difference between revisions of "Charge Metrics Proposal"
Bbzheng.2015 (talk | contribs) |
Srchua.2015 (talk | contribs) (→Data) |
||
| Line 58: | Line 58: | ||
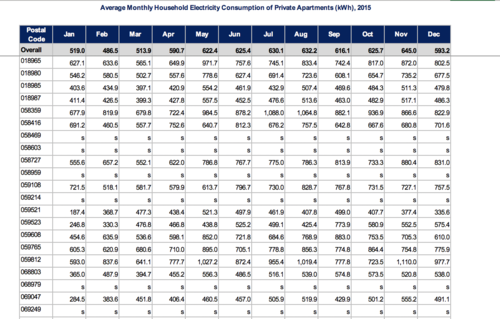
<center>Source: https://www.ema.gov.sg/Statistics.aspx </center> | <center>Source: https://www.ema.gov.sg/Statistics.aspx </center> | ||
|| | || | ||
| − | * Postal Code | + | * Postal Code |
| − | * | + | * Type of Dwelling |
| − | * Month | + | * Month (2013-2016) |
* Electricity Consumption | * Electricity Consumption | ||
|| | || | ||
Revision as of 02:21, 15 October 2018
| HOME | PROJECT POSTER | RESEARCH PAPER |
Contents
Motivation
Household electricity consumption in Singapore has increased by about 17% over the past decade, according to a report by the National Environment Agency in May 2018. On aggregate levels, Singapore households consumed 7,295 GWh (gigawatt hours) in 2017, which roughly translates to an average expenditure of $1,000 a year on electricity per household.
Electricity consumption is a national issue, especially given that Singapore has finite energy sources. It is therefore important to encourage households to consume electricity in more sustainable ways.
Traditionally, the lack of transparency surrounding electricity use has been acknowledged as a possible challenge in raising awareness on electricity consumption. Improving visualisation of household electricity consumption can help people in Singapore gain better clarity of their consumption habits and expenditure, and thus more incentive to reduce electricity usage.
Our project visualises the distribution of household electricity consumption across planning regions in Singapore, accounting for type of residential homes, income and demographic profiles. We aim to better communicate electricity consumption in everyday life to people in Singapore, and ultimately engage them to reduce electricity consumption.
Objectives
Data
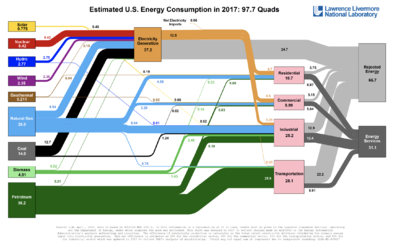
| Datasets | Data Attributes | Rationale Of Usage |
|---|---|---|
|
| |
(https://www.mytransport.sg/content/mytransport/home/dataMall.html#) |
|
|
(https://www.mytransport.sg/content/mytransport/home/dataMall.html#) |
|
|
(https://data.gov.sg/dataset/master-plan-2014-subzone-boundary-no-sea) |
|
|
Related Works
| Related Works | What We Can Learn |
|---|---|
|
|
|
|
| |
|
| |
|
|
Prototype
Landing Page

[1]Logo
[2]Bivariate Chloropleth Map
[3]Filter
[4]Button to Historical Trend Page
[5]Slope Graph
Historical Trend Page

[1]Area Chart for Total Electricity Consumption
[2]Area Chart for Number of Singapore Resident
[4]Rate of Change of Number of Singapore Resident and Total Electricity Consumption
[3]Connected Scatter Plot
Project Schedules
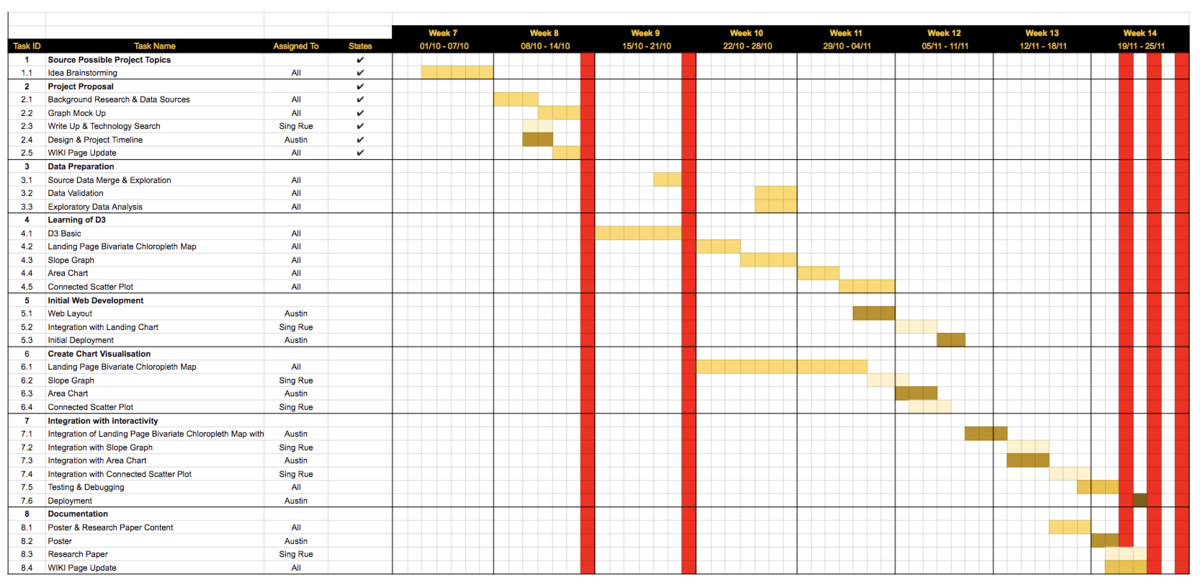
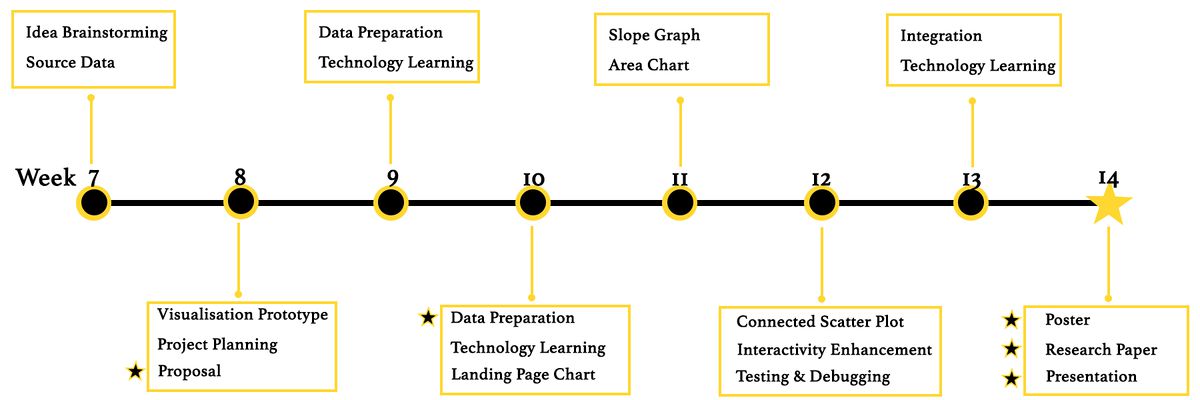
Project Schedule on Google Sheet:https://docs.google.com/spreadsheets/d/1IlT3Na8Ujlv9izY-0PWvCWEWzfqOmzq3jGHIbWCDiwk/edit?usp=sharing
Challenges
| Challenges | Possible Solutions |
|---|---|
|
Unfamiliar with D3.js |
|
Data Merge, Cleaning and Transformation |
|
Choice of web hosting provider |
|
Unfamilar with implementation efforts required for customized D3.js interactivity |
|
References
[1] Energy Market Authority (https://www.ema.gov.sg/singapore_energy_statistics.aspx)
[2] Data Gov Database (https://data.gov.sg)
[3] D3.js (Documentation https://d3js.org/)
[4] Observalehq (https://beta.observablehq.com/)
[5] One Map (https://www.onemap.sg/main/v2/)
[6] Energy Consumption Predition Example (http://cs109-energy.github.io/building-energy-consumption-prediction.html)
Feedback
Please feel free leave your comments, suggestions or anything interesting :)

