ISSS608 2017-18 T3 Assign Saurav Jhajharia (Q1)
VAST Challenge 2018 MC2: Like a Duck to Water
Contents
Q1
Characterize the past and the most recent situation with respect to chemical contamination in the Boonsong Lekagul waterways.
Do you see any trends of possible interest in this investigation?
Anomalies (Chemical wise)
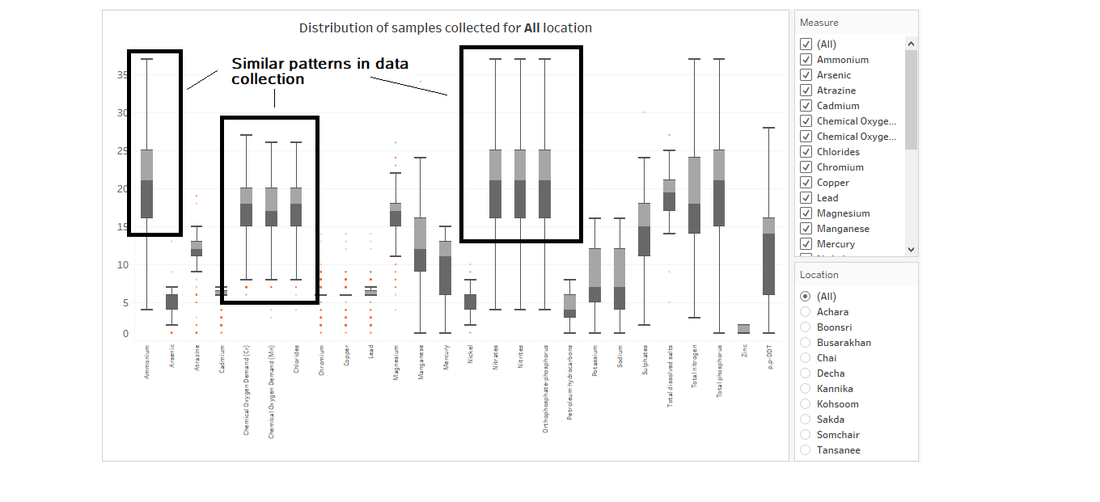
The following box plot indicates that the number of samples collected for some chemicals over all locations were highly identical in nature. This is strangely coincident. The chemicals are Ammonium, Nitrates, Nitrites, and Orthophosphate-phosphorous & Chemical oxygen demand (Cr & Mn) and Chlorides.
Anomalies (Location wise)
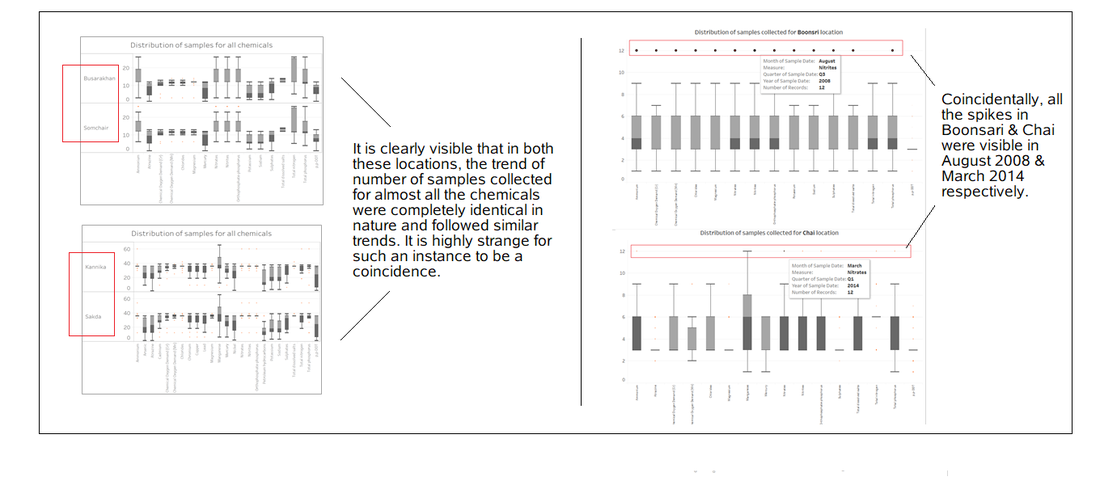
The following box plot indicates that there are sets of 2 locations each where the trend in the number of samples collected was strangely identical in nature. These location sets are Busarakhan and Somchair & Kannika and Sakda.
Trends (Location wise)
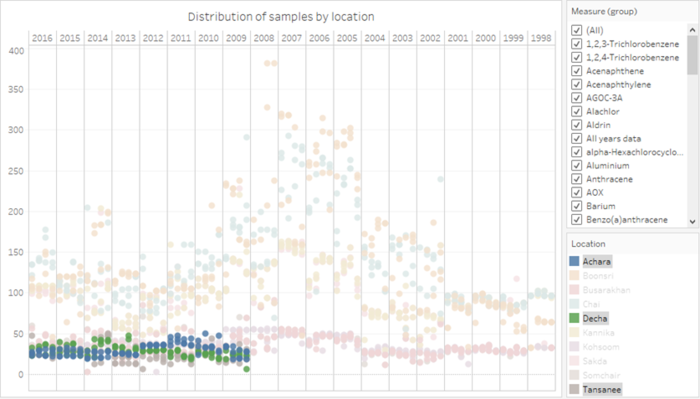
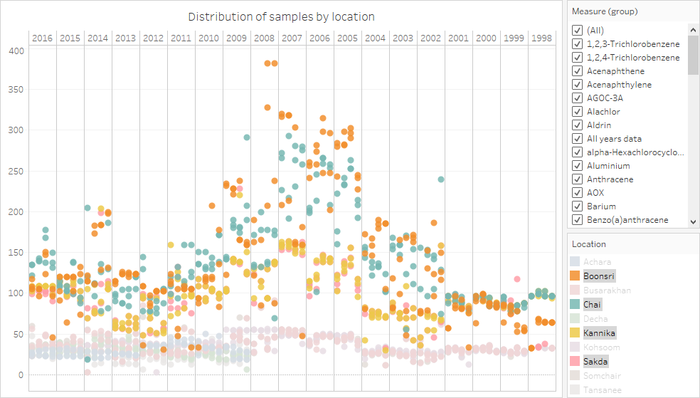
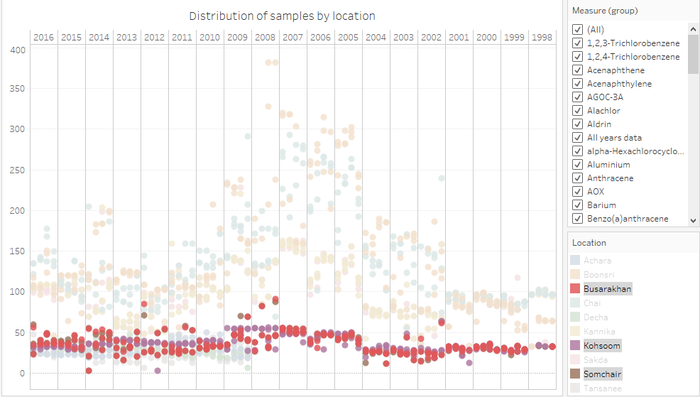
The following dot plots indicate that the data collection patterns were not homogeneous across all locations. Locations could be divided into 3 groups depending on how the data collected in those areas were visible.
1.Achara, Decha, Tansanee: These are locations were data was collected from 2009 onwards only.
2.Busarakhan, Kohsoom, Somchair: These are locations where data is spread over the years but the range of data collected for chemicals is very small.
3.Sakda, Kannika, Chai, Boonsari: These are locations where data is spread out with a very high range of values for all chemicals.
Tableau Public
This dataset has been published on Tableau Public. It can be accessed here.
