ISSS608 2017-18 T3 Assign Luo Haoran Data Preparation
Jump to navigation
Jump to search
|
|
|
|
|
|
Raw Data Overview
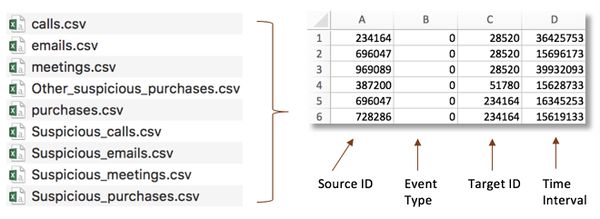
- In total there are 9 event data tables, recording calls, emails, purchases and meetings across the company.
- Insider has already marked out suspicious calls, emails, purchases and meetings and made them isolated data tables.
- No column name for all 9 data tables. However, the format of them are the same.
- 1. Source: contains the company ID# for the person who called, sent an email, purchased something, or invited people to a meeting
- 2. Etype: contains a number designating what kind of connection is made.
- a. 0 is for calls
- b. 1 is for emails
- c. 2 is for purchases
- d. 3 is for meetings
- 3. Destination: contains company ID# for the person who is receiving a call, receiving an email, selling something to a buyer, or being invited to a meeting.
- 4. Time stamp: is in seconds starting on May 11, 2015 at 14:00.
Data Aggregation
- Applied the same command to 9 event data tables to add column names.
- Corresponding Column Name: Source, Etype, Destination, TimeStamp
2. Convert TimeInterval to TimeStamp

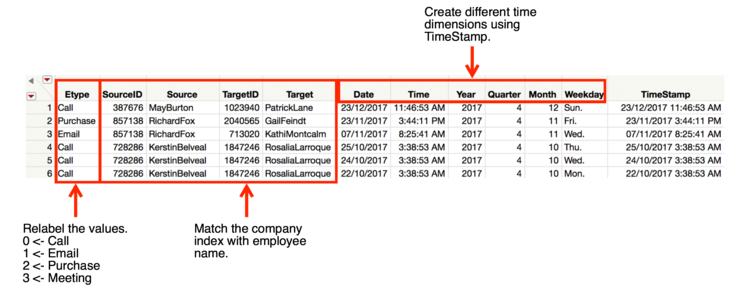
- Changed TimeInterval in original data tables into TimeStamp in format of dd/mm/yyyy hh:mm:ss.
- Initial time is 11/05/2015 14:00:00.
- Saved new data tables with TimeStamp to the path.
- Relabeled values in Etype column.
- Added names for sources and targets according to SourceID (company index) and TargetID (company index).
- created new columns indicating different time dimensions.
5. Create Nodes and Edges Data Using Suspicious Employee List
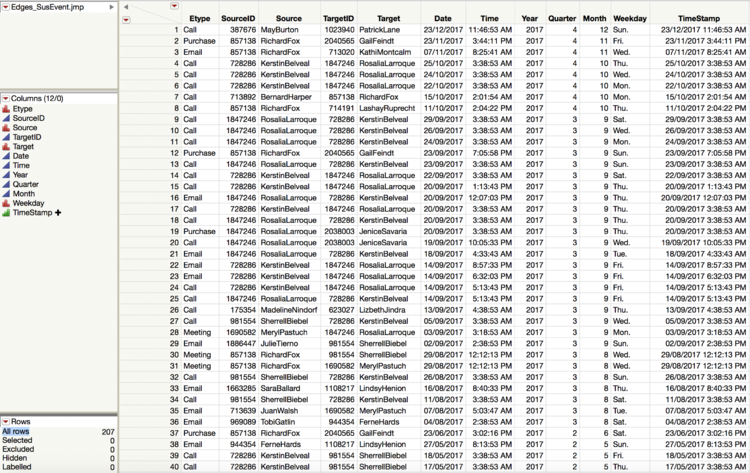
- 5.1 Edges_Suspicious Event Data
- Select out all events initiated or accepted by the suspicious employees.
- Concatenate data tables together and get a merged data table as Edges_SusEvent.
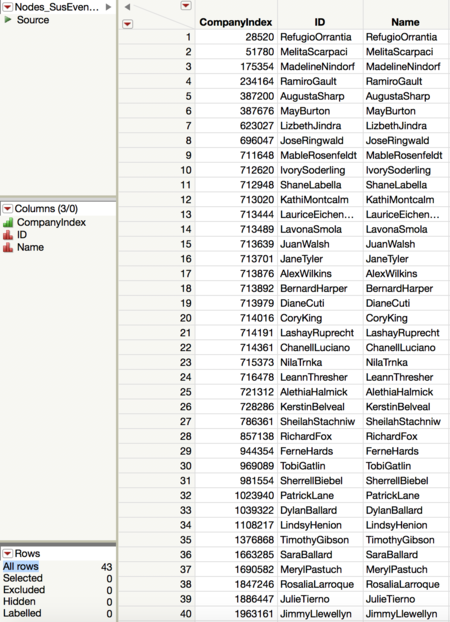
- 5.2 Nodes_Suspicious Employee Data
- By using the Edges table created, all the employees involved in the suspicious behavior can be filtered out.
- Except for 20 employees the insider points out, there might be more people doing bad things.


