ISSS608 2016-17 T3 Assign GAURAV MIGLANI Visualizations
|
|
|
|
"Question 1: Characterizing the past and most recent situation"
Characterize the past and most recent situation with respect to chemical contamination in the Boonsong Lekagul waterways. Do you see any trends of possible interest in this investigation? Your submission for this questions should contain no more than 10 images and 1000 words.
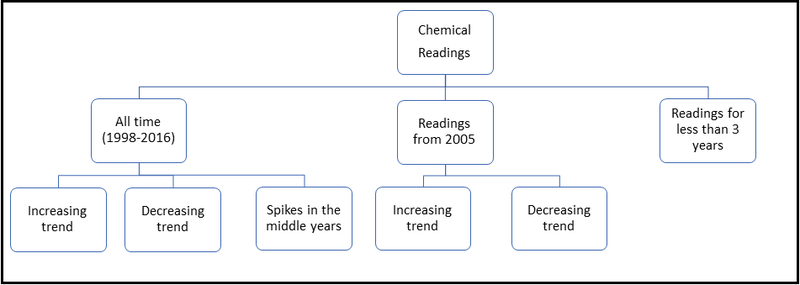
For understanding the past and the most situation in Boonsong Lekagul waterways, I have grouped the chemicals according to the number of readings taken over time. The chart below shows how the chemicals have been grouped. There are approximately 31 chemicals for which the recordings have been taken for almost all the years continuously.
Also, for another 51 chemicals readings have been taken in a Hap hazardous way and are present for less than 3 years. Moreover, I have also grouped chemicals that have readings continuously from 2005 onwards and have shown their trend as well.
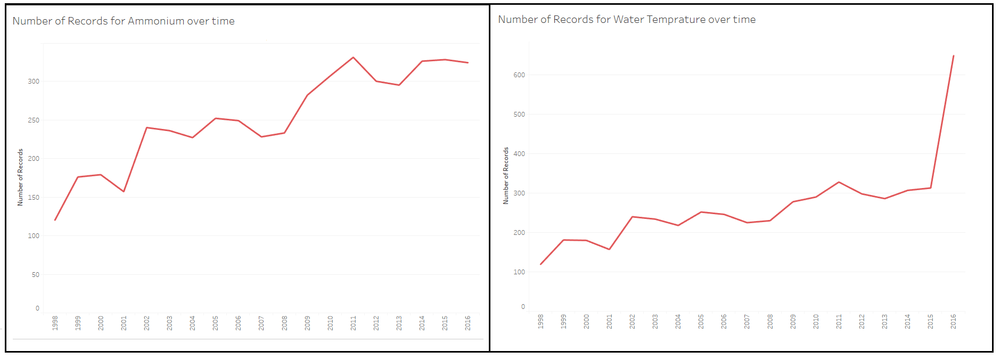
For the chemicals that have readings in all the years from 1998, we have grouped the chemicals in 3 sub-categories as shown in the hierarchical chart above. The first sub-category reflects the increasing trend in the readings taken for Ammonium and Water temperature as shown below.
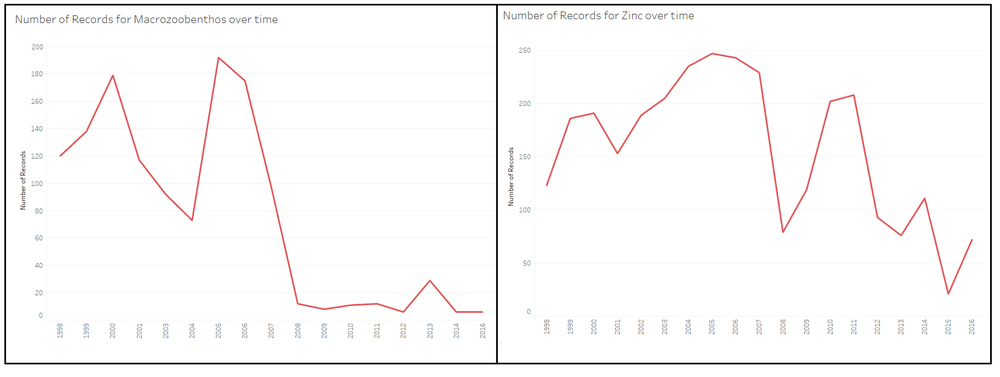
Similarly, for the line graph below we observe that there is also a decrease in the reading of certain chemicals like zinc and macrozoobenthos after year 2005-2006.
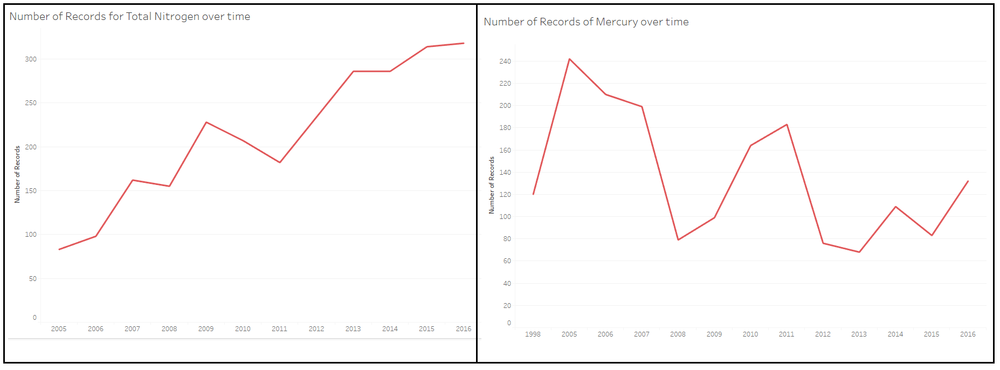
For the second group we will now observe the trend of chemicals for which the readings have been taken after year 2005. For Total Nitrogen, the number of readings taken over time has increase and the reverse is true for Mercury which has seen a decrease in number of readings as shown below.
"Question 2: Anomalies in the waterway samples dataset"
What anomalies do you find in the waterway samples dataset? How do these affect your analysis of potential problems to the environment? Is the Hydrology Department collecting sufficient data to understand the comprehensive situation across the Preserve? What changes would you propose to make in the sampling approach to best understand the situation? Your submission for this question should contain no more than 6 images and 1000 words.
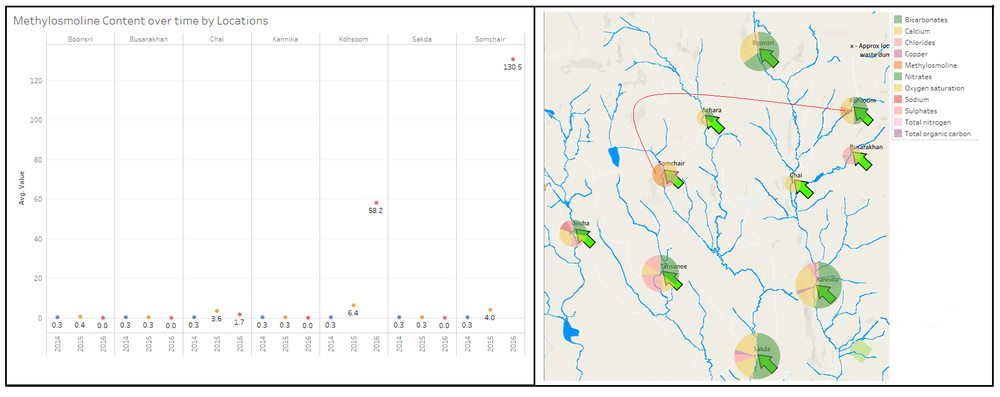
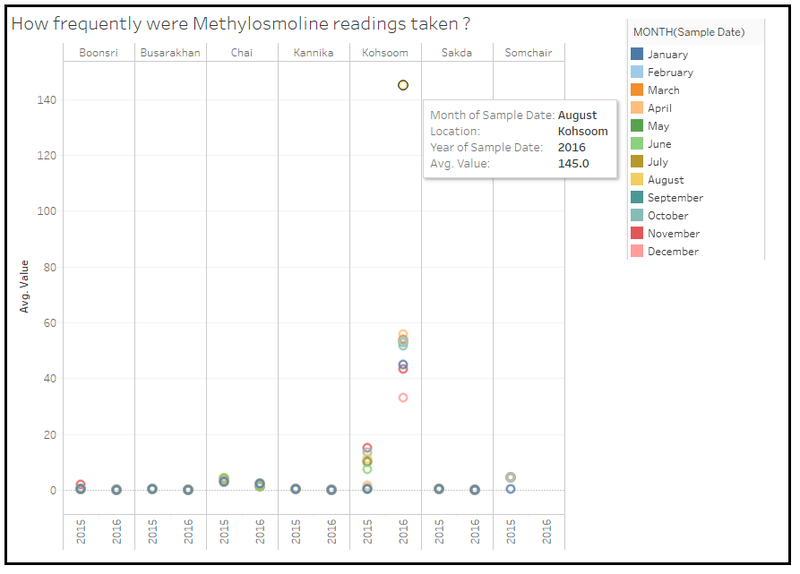
There are some anomalies that are present in the dataset provided to us. In the graph shown below we observe that, the chemical Methylamine (the toxic manufacturing chemical in the suspected dumping) has risen to a significant level in 2016 in two of the locations particularly shown by the red line in the graph below.
With the help of map, we may imply that the increase in Kohsoom may be due to its proximity to the dumping ground where as the increase of Methylamine in Somchair might be due to its proximity to the Factory. The circle view also helps us to figure out that the amount of level has increased by almost 21 folds in Somchair and 9 times in Kohsoom from 2015
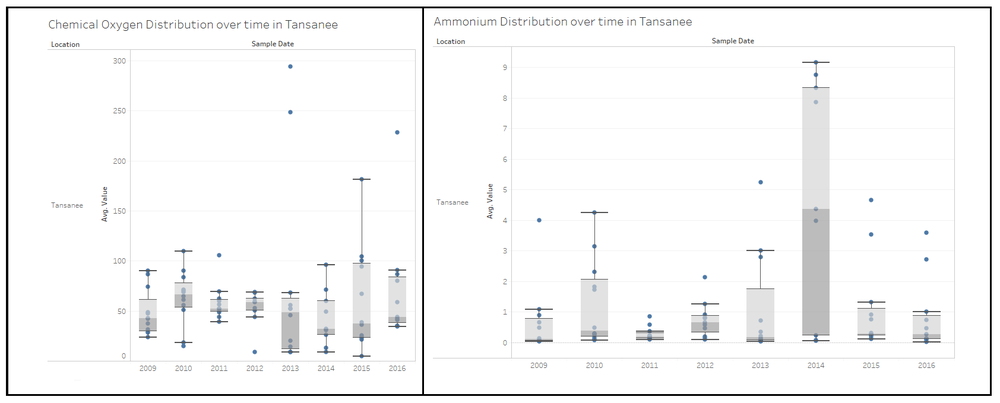
The following box plots shows distribution of Ammonium and Chemical Oxygen over time in Tansanee. We observe that in all the years there are certain outliers and also the range of the values of Ammonium in 2014 increases to a great extent. Similarly, for Chemical Oxygen, the range of values increase in the year 2015 particularly.
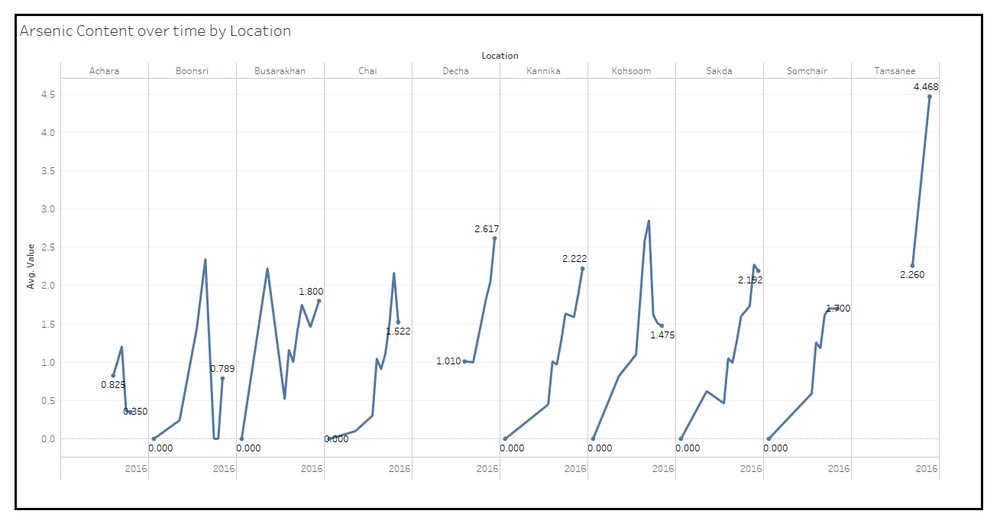
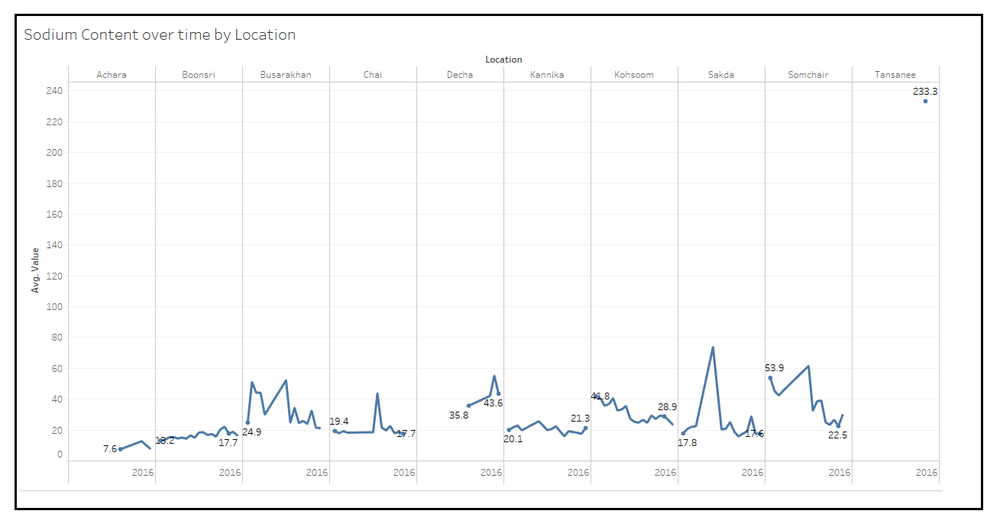
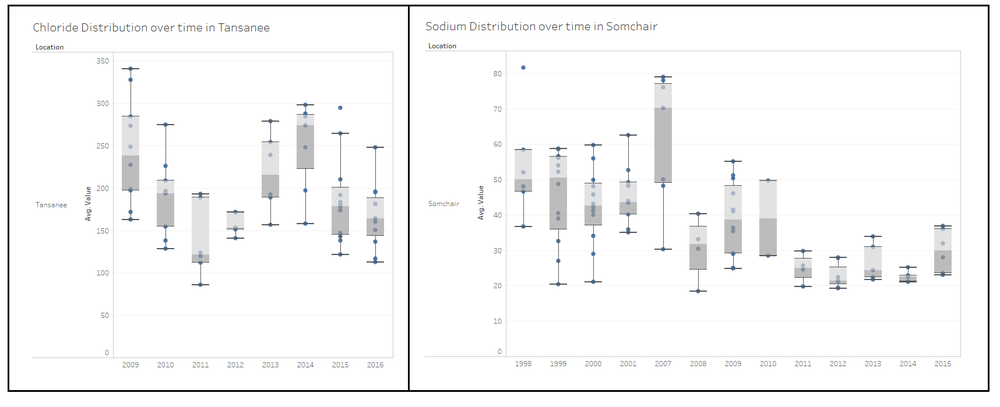
Another anomaly is shown by significantly high value recorded for Tansanee for chemicals like Arsenic and Sodium compared with other locations. (shown by the graph below). Moreover, there is only one reading for sodium in Tansanee for the entire time period of 18 years.
From our analysis perspective, we see that there are not enough values for Tansanee for chemicals like Arsenic and Sodium. Particularly for sodium, we only have single reading and it is highly possible that this value might be caused due to some human error. So, concluding the result on the basis of one reading might mislead our analysis. Also, from Boxplot we observe that the reading for Tansanee are not present prior to year 2009 for both the chemicals (Ammonium and Chemical Oxygen.)
If we look at the data collected by Hydrology Department over time, there is no specific pattern being followed and moreover the readings taken are too sparse. In case of our first example of Methylamine, the toxic manufacturing chemical in the suspected dumping, the reading have been taken regularly only for Kohsoom. As shown in the graph below, there is no reading for most of the months including the month of August where high value was recorded for Kohsoom. If we would have had the readings for the month of August for all the locations, we could have probably identified the root cause for such a high value. It seems to be sheer negligence by Hydrology department.
In order to better understand the situation a rigid pattern of recording the readings should be followed which will help us better understand the root cause for the rise and fall of Chemical values over time. I would suggest recording readings weekly would help in the analysis since the change in values would then become clearer.
"Question 3: Suggesting changes in the sampling strategy "
After reviewing the data, do any of your findings cause particular concern for the Pipit or other wildlife? Would you suggest any changes in the sampling strategy to better understand the waterways situation in the Preserve? Your submission for this question should contain no more than 6 images and 500 words.
Due to increase in chemicals in recent times it is possible that the aquatic life or the pipit population might be affected. According to United States Environmental Protection Agency the maximum limit for Chloride in water should be 250mg/l. We observe from the boxplot below that the Chloride content in Tansanee has most of the times exceeded the permissible limit. Moreover, according to “EPA”, the amount of Sodium in water should not exceed more than 20mg/l. We can clearly see that in Somchair the amount of sodium has been always been more than 20mg/l. The increased chemical content may possibly harm the aquatic and pipit population in these areas.
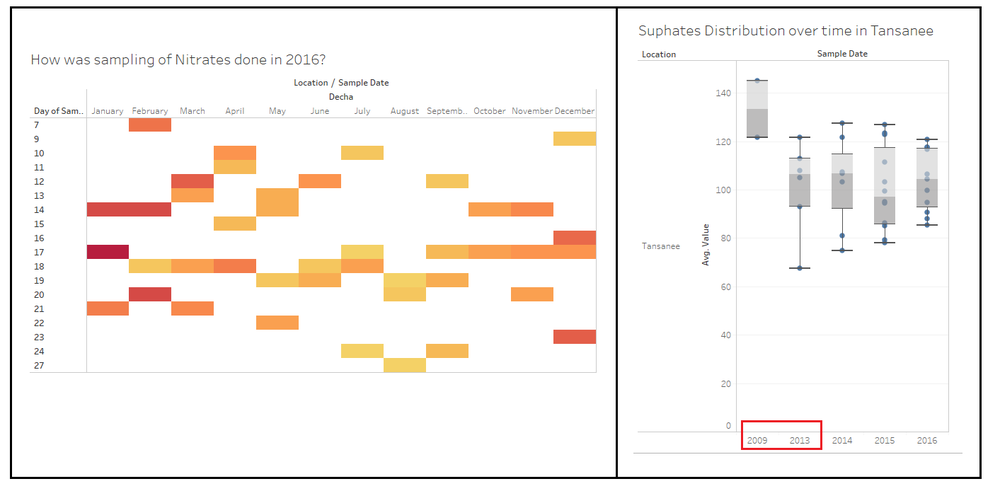
We observe from the heat map below that the recording taken do not follow any particular pattern and have been taken randomly which might prevent us from accurate analysis. If the reading were taken daily either by automating the process or manually, the analysis results would be more precise. If the procedure mentioned above is not possible then the readings should be taken at least on weekly basis for each of the chemicals for all locations.
Also, from the box plot we observe that for Sulphates in Tansanee, high reading was recorded for the year 2009, but for the subsequent 4 years the readings were missing. If the process of collecting the readings can be automated, then this problem can be avoided.

