ISSS608 2017-18 T3 Assign Minami Yusuke
Author
Yusuke MINAMI
<a href="https://www.linkedin.com/in/yusukeminami">https://www.linkedin.com/in/yusukeminami</a>
Background
This page is my submission for ISSS608 Visual Analytics
and Applications course assignment based on VAST Challenge 2018
Mini-Challenge 3.
The datasets were downloaded from:
VAST Challenge 2018 Mini-Challenge 3
<a href="http://vacommunity.org/VAST+Challenge+2018+MC3">http://vacommunity.org/VAST+Challenge+2018+MC3</a>
Tasks
- Using the four large Kasios International data sets, combine the different sources to create a single picture of the company. Characterize changes in the company over time. According to the company’s communications and purchase habits, is the company growing? Limit your responses to 5 images and 500 words.
- Combine the four data sources for group that the insider has identified as being suspicious and locate the group in the larger dataset. Determine if anyone else appears to be closely associated with this group. Highlight which employees are making suspicious purchases, according to the insider’s data. Limit your responses to 8 images and 500 words.
- Using the combined group of suspected bad actors you created in question 2, show the interactions within the group over time. Limit your responses to 10 images and 1000 words
- Characterize the group’s organizational structure and show a full picture of communications within the group.
- Does the group composition change during the course of their activities?
- How do the group’s interactions change over time?
- The insider has provided a list of purchases that might indicate illicit activity elsewhere in the company. Using the structure of the first group noted by the insider as a model can you find any other instances of suspicious activities in the company? Are there other groups that have structure and activity similar to this one? Who are they? Each of the suspicious purchases could be a starting point for your search. Provide examples of up to two other groups you find that appear suspicious and compare their structure with the structure of the first group. The structures should be presented as temporal not just structural (i.e., the sequence of events—A is followed by B one or two days later—will be important). Limit your responses to 10 images and 1200 words
1. Elucidate changes of the company over
time
2. Locate the suspicious group, elucidate the employees closely associated with the suspicious group, and highlight the employees who are making suspicious purchases
3. Elucidate the interactions within the suspicious group over time
4. Elucidate the Potentially illicit purchases
Data Preparation
Data was prepared by Python in Jupyter notebook environment taking advantage of
Pandas library.
1.
Read the following 4 CSV files including connections and
concatenate.
calls.csv
emails.csv
meetings.csv
purchases.csv
Convert the seconds since May 11, 2015 at 14:00 to Timestamp data type.
Calculate the hour-level timestamp for summarization later.
Convert the Etype code (0-3) to call, email, meeting, or purchase.
Change the long format to wide format with summarizing the counts for each connection type (call, email, meeting, or purchase) in hour-level time slots.
Save as CSV file "wide_df.to_csv('VAST_Summary_Wide.csv".
2. & 3.
Read the following 4 CSV files including the suspicious
connections and concatenate.
Suspicious_calls.csv
Suspicious _emails.csv
Suspicious _meetings.csv
Suspicious _purchases.csv
Extract the suspicious employee list.
Add Source Suspicious flag (whether the source node is in the suspicious list), Target Suspicious flag (whether the target node is in the suspicious list), and Employee Suspicious flag (whether either the source or target is in the suspicious list).
Extract connections with Employee Suspicious flag = True.
Add the employee name by joining "CompanyIndex.csv" on employee IDs.
Save as "Emp_Suspicious.csv".
Change the long format to wide format with summarizing the counts for each connection type (call, email, meeting, or purchase) in hour-level time slots.
Save as "Emp_Suspicious_Wide.csv".
Calculate the month-level timestamp.
Save as "Emp_Suspicious_Wide_YM.csv"
Extract the unique suspicious employee IDs.
Add the employee name by joining "CompanyIndex.csv" on employee IDs.
Save as "Suspicious_Nodes.csv".
4.
Read "Other_suspicious_purchases.csv"
Extract the list of employees who made potentially illicit purchases.
Add Source Potentially Illicit flag to the larger dataset, and extract only the Source Potentially Illicit flag = True.
Add Potentially Illicit flag.
Save as “Potentially_Illicit.csv”.
Design of Visualization
Tableau Desktop Professional Edition 2018.1.0 and Gephi 0.9.2 were used to
visualize the datasets.
1.
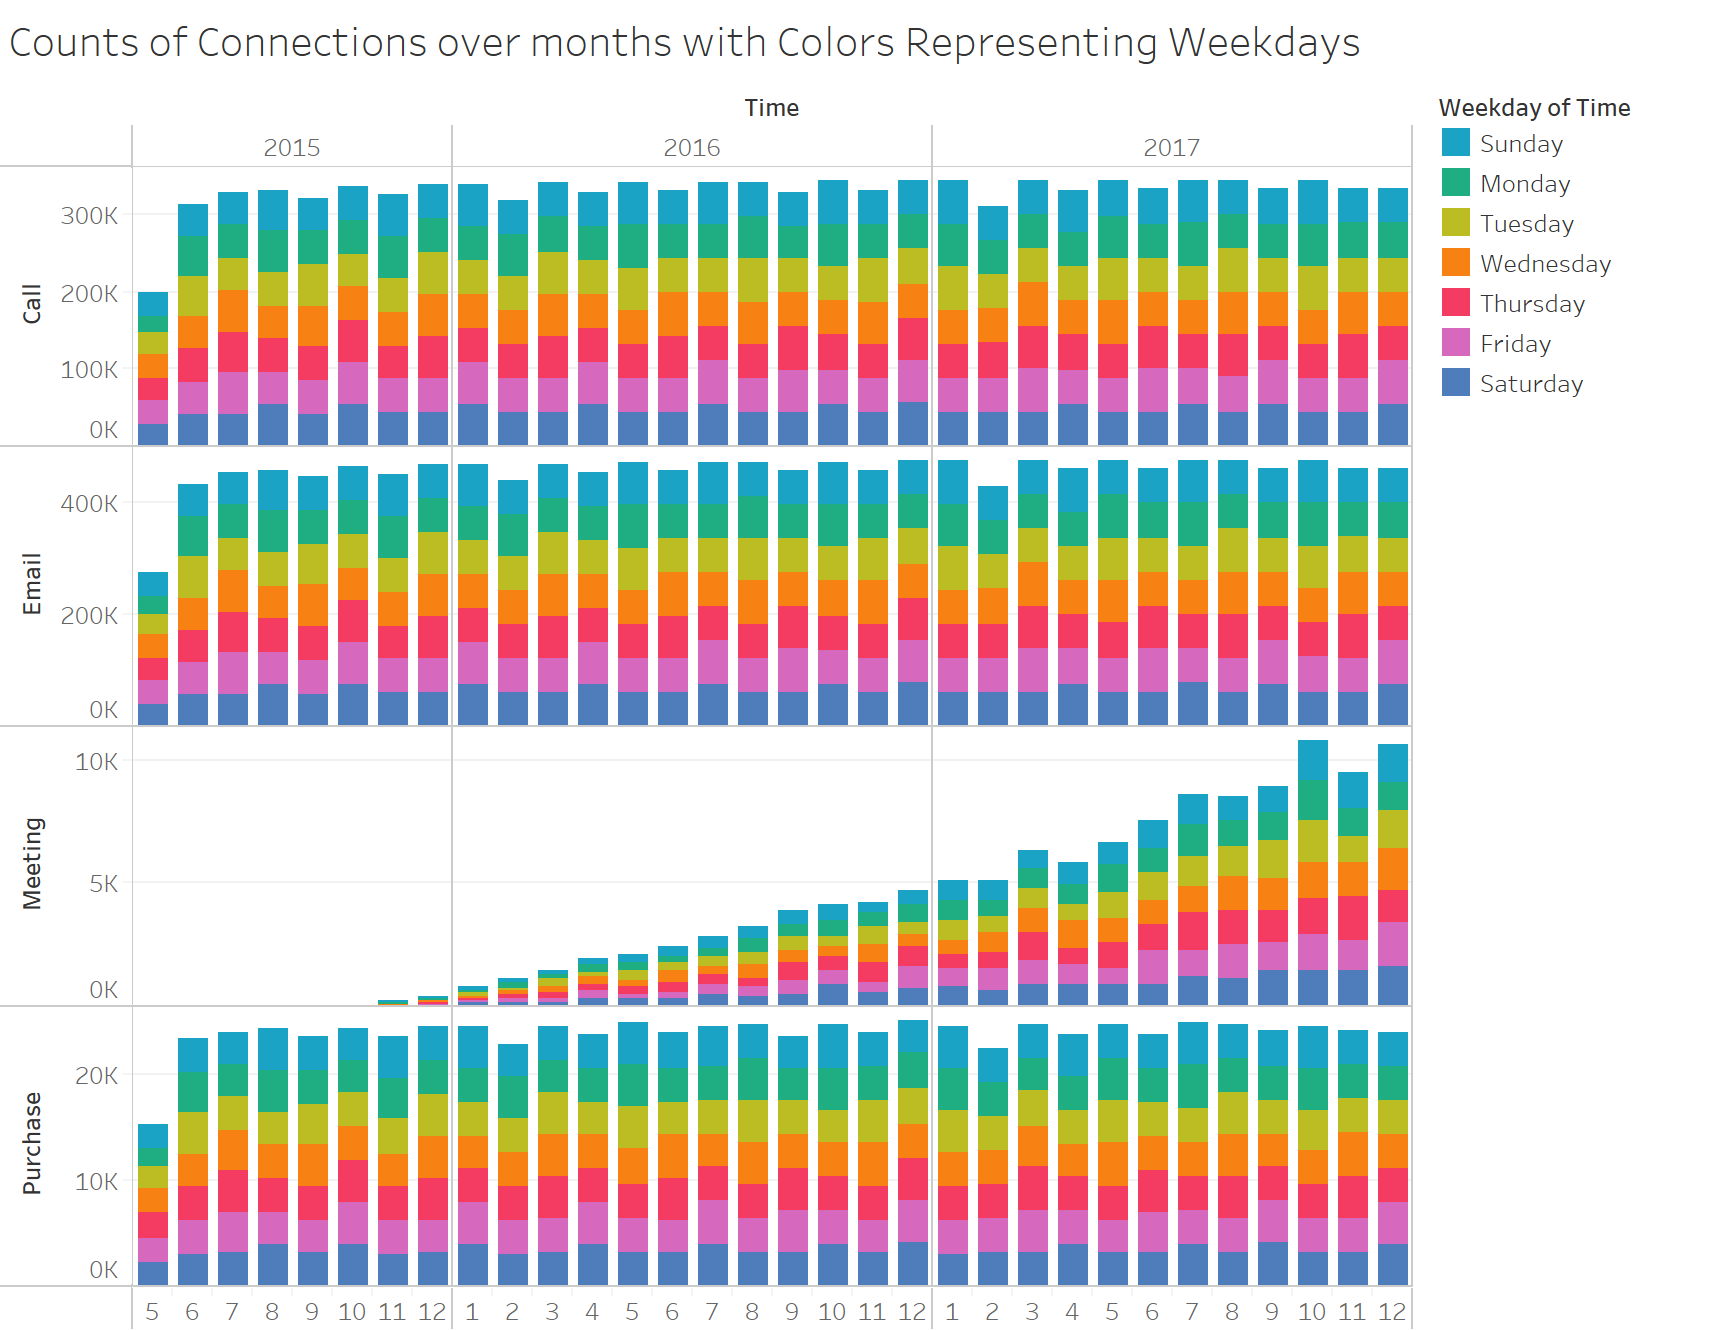
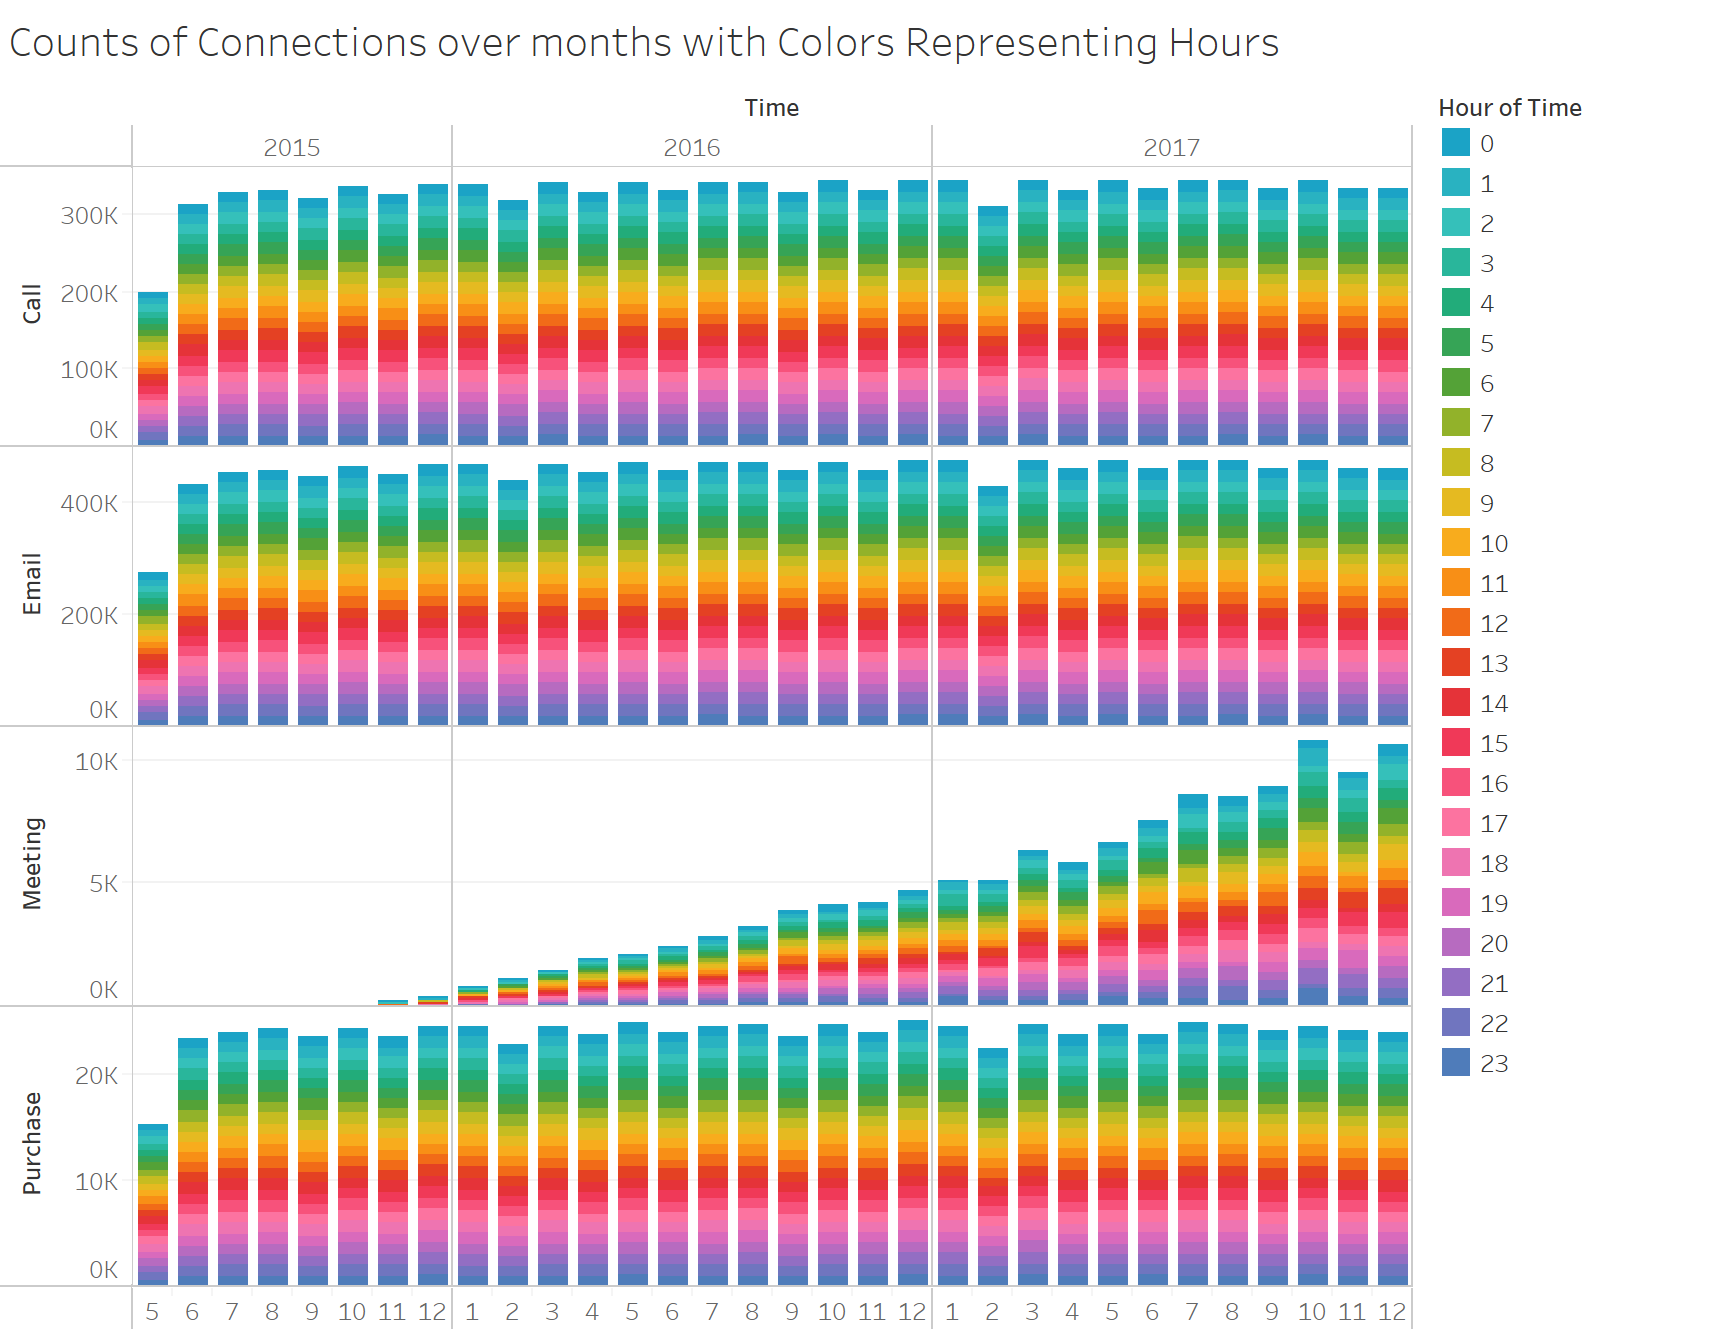
Counts for each of the 4 connection types (calls, emails, meetings, and purchases) in each month were visualized. Colors were used to differentiate the weekday, hour, and day to explore any patterns.
2. & 3.
In Graph Theory, Adjacency Matrix is used to describe the existence of edges
between nodes. Weighted Adjacency Matrix (or simply Adjacency Matrix in a broad
sense) is used to indicate the weight of each edges. The employees were treated
as nodes, the connections between them as edges, and the counted numbers as
weight of edges. Since the source nodes and target nodes are distinguished, the
given dataset can be treated as a directed graph. Source nodes are the
employees who called, sent an email, purchased something, or invited people to
a meeting. Each of the 4 connection types (calls, emails, meetings, and purchases)
that form directed graphs can be described by Adjacency Matrix. It is also
possible to include 4 weight values for each edge type in each cell of an
Adjacency Matrix of a multigraph, but multiple numeric values in each cell
sacrifices the interpretability.
In this assignment, a new
visualization methodology “Treemap Adjacency Matrix” is proposed. A Treemap
Adjacency Matrix indicates multiple weights in each cell by treemap utilizing
the rectangle area for weight and color for edge type. Treemap Adjacency
Matrices were generated for source nodes listed as suspicious and target nodes
listed as suspicious according to the anonymous insider. For source nodes
listed as suspicious, the edges representing connections (calls, emails,
meetings, and purchases) initiated by the 20 suspicious source nodes were
extracted. Both source node and target nodes were sorted in the descending
order of connection counts. Since there are too many target nodes not listed as
suspicious, only the target nodes with connections more than a threshold value
7. Treemap Adjacency Matrices were generated likewise for targets nodes listed
as suspicious with the threshold value 9.
To characterize the structure, communication within the group, and
change over time, Gephi was used. For layout, Fruchterman Reingold was used to
avoid overlapping of nodes. For nodes, only the 20 suspicious employees were
highlighted by red color and the labels were added. As the labels, the ID
numbers instead of employee names were used as names occupy more space that
causes overlapping each other. For edges, calls were highlighted by blue color
(the lighter blue, the more calls). The other connections were colored gray.
4.
The other connections on the days the 4 employees made
potentially illicit purchases were visualized.
Insights
<img border=0 width=903 height=700 id="Picture 1" src="VA_Assign_VAST_MC3_files/image001.jpg">
<img border=0 width=747 height=579 id="Picture 2" src="VA_Assign_VAST_MC3_files/image002.jpg">
<img border=0 width=661 height=523 id="Picture 3" src="VA_Assign_VAST_MC3_files/image003.jpg">
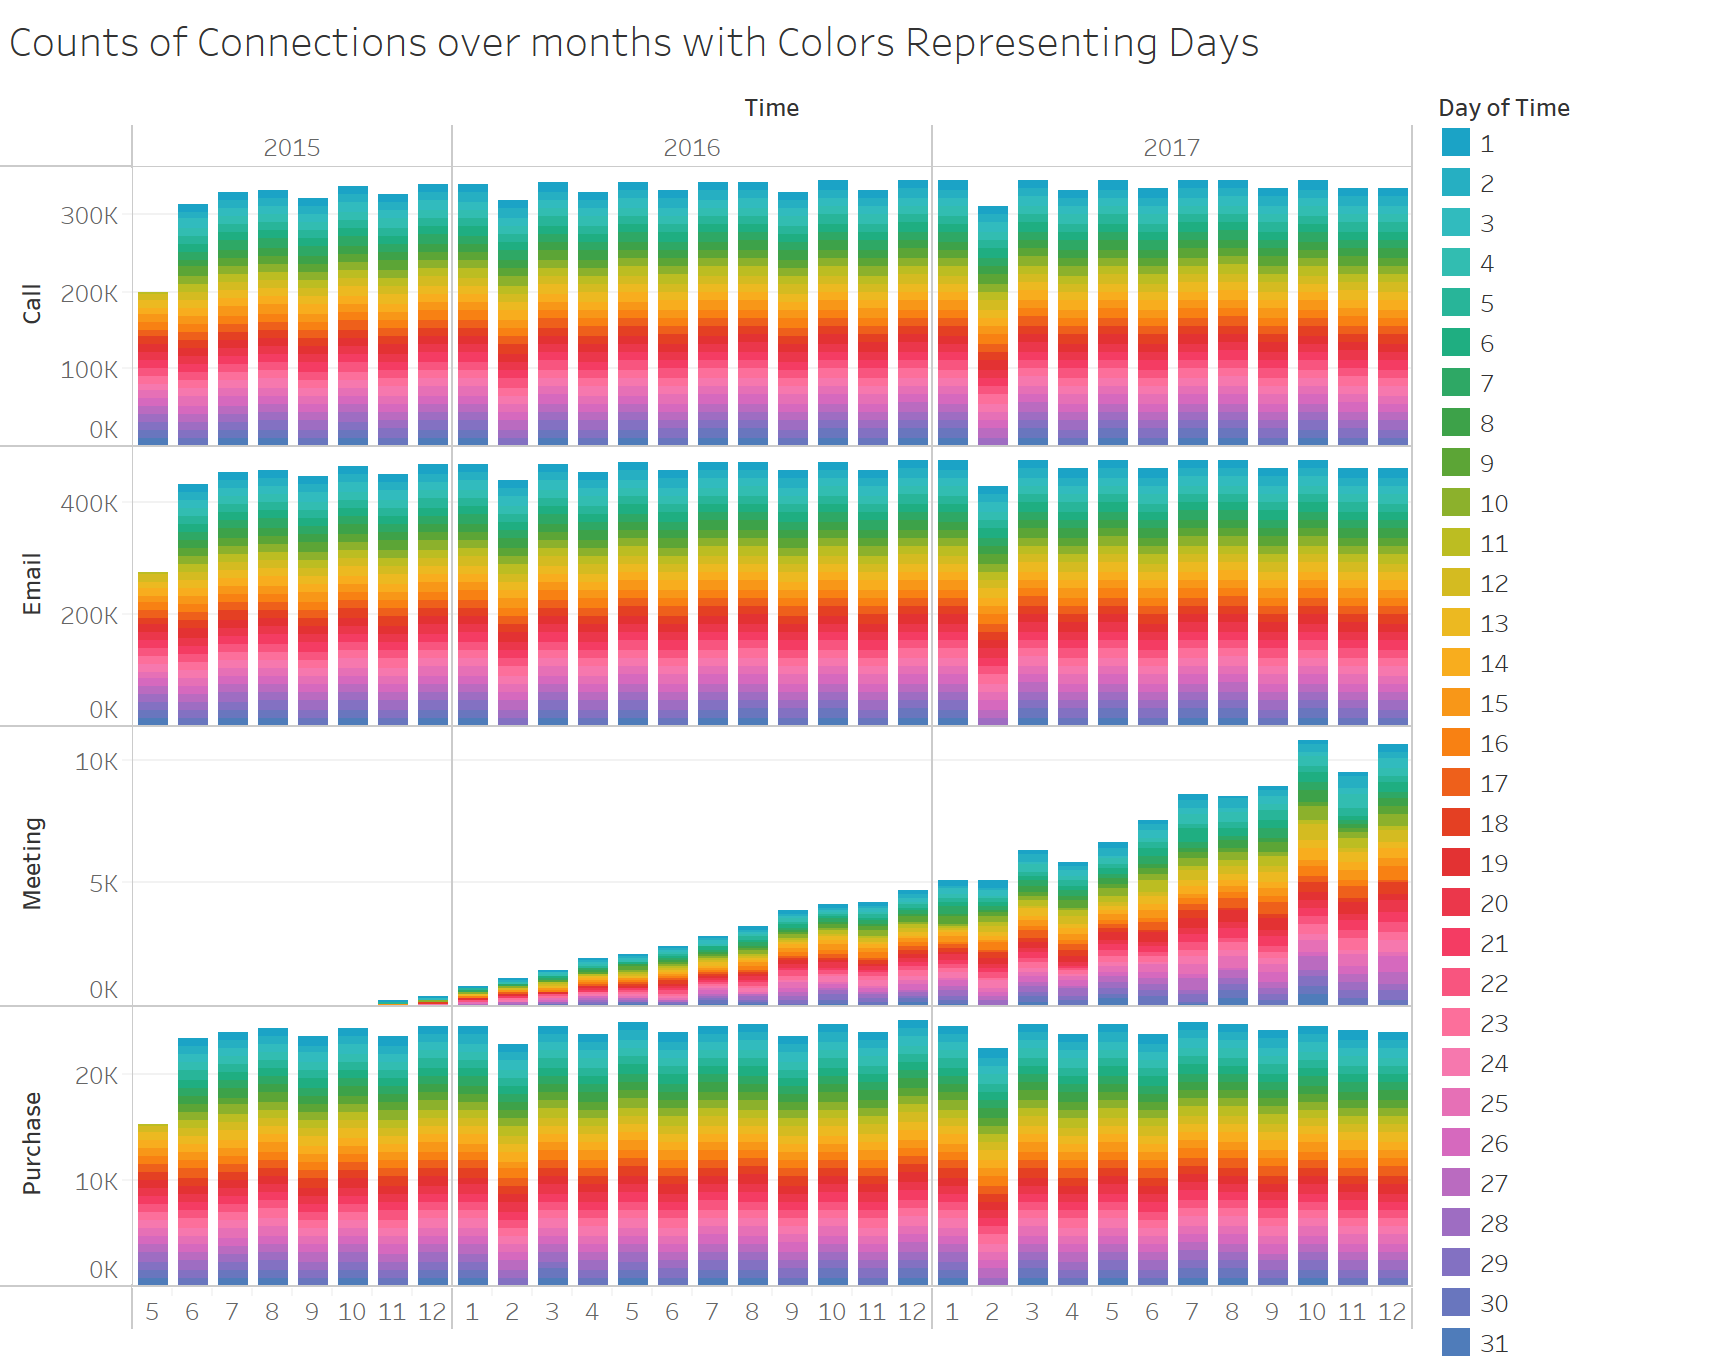
Numbers of calls, emails, and purchases had been almost constant. Number of meetings had been increasing rapidly. The distributions in weekdays (Sunday - Saturday), hours (0 - 23), and days (1-31) were almost equally distributed over the whole period, and no change was observed. The pattern indicates that the datasets were artificially generated.
<img border=0 width=1125 height=666 id="Picture 4" src="VA_Assign_VAST_MC3_files/image004.jpg">
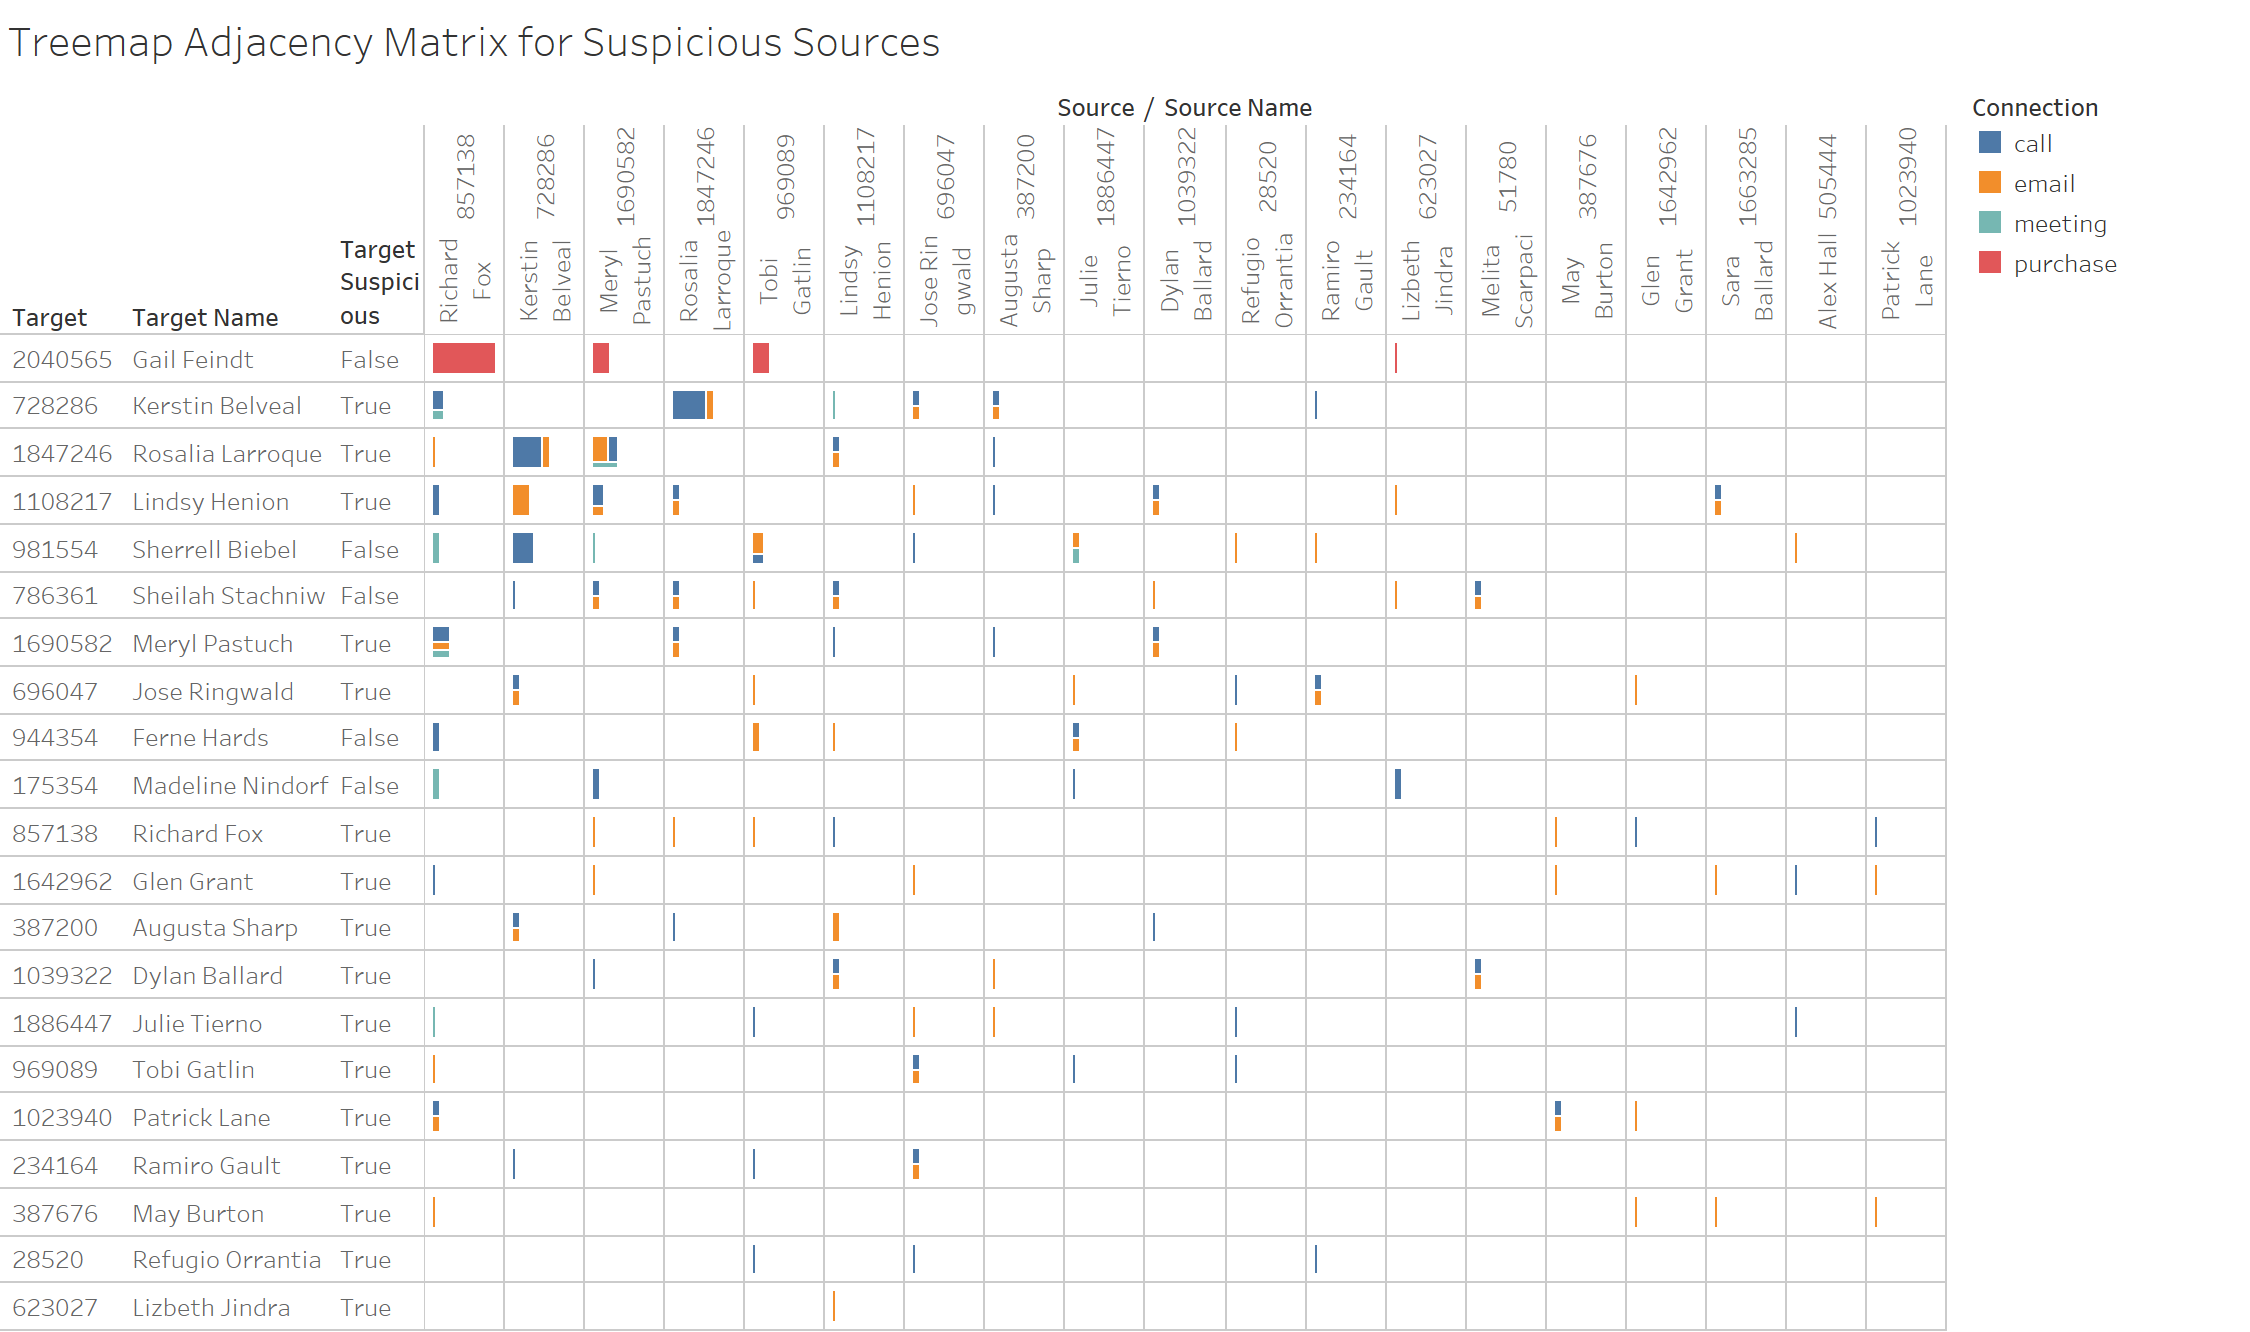
The 20 suspicious employees are listed in the columns. Employee ID 2040565 (Gail Feindt), ID 981554 (Sherrell Biebel), ID 786361 (Sheilah Stachniw), ID 944354 (Ferne Hards), and ID 175354 (Madeline Nindorf) received connections (calls, emails, meetings, and/or purchases) from the 20 suspicious employees and appear to be closely associated with the suspicions employees. Employee ID 2040565 (Gail Feindt) received the dominant number of purchase transactions; 15 by Employee ID 857138 (Richard Fox), 4 by Employee ID 1690582 (Meryl Pastuch), 4 by Employee ID 969089 (Tobi Gatin), and 1 by ID 623027 (Lizbeth Jinbra).


<img border=0 width=1125 height=665 id="Picture 15"
src="VA_Assign_VAST_MC3_files/image005.jpg">

The 20 suspicious employees are listed in the columns. Employee ID 175354
(Madeline Nindorf), ID 786361 (Sheilah Stachniew), ID 981554 (Sherrel Biebel)
made connections to the 20 suspicious employees and appear to be closely
associated with the suspicious employees. The phone calls between ID 1847246
(Rosalia Larroque) and ID 728286 (Kerstin Belveal) are notable; 8 from ID
1847246 and 7 from ID 728286.
<img border=0 width=1261 height=230 id="Picture 17"
src="VA_Assign_VAST_MC3_files/image006.jpg">

The connections with suspicious employees involved on 20th September
2017, on which suspicious purchase was recorded, were plotted. Suspicious phone
calls between ID 1847246 (Rosalia Larroque) and ID 728286 (Kerstin Belveal) and
purchase by ID 1847246 (Rosalia Larroque) were recorded at the same time
(3:38:53AM). Later in the afternoon on the same day, ID 1847246 (Rosalia
Larroque) sent an email to ID 728286 (Kerstin Belveal), and ID 728286 (Kerstin
Belveal) called , ID 1847246 (Rosalia Larroque), and then ID 1847246 (Rosalia
Larroque) made second purchase, which was recorded as suspicious.
<img border=0 width=1152 height=905
id="Picture 5" src="VA_Assign_VAST_MC3_files/image007.jpg">

The fiture above describes the counts of connections (calls, Emails, meetings,
andn purchases) involved with suspicious employees (as source and/or target)
including the ones listed as suspicious. There were 2 notable months; November
2015 and September 2017.
In Novmeber 2015 and September 2017,
comparatively more suspicous connections, especially calls were recorded. In
addition, there were compartively more meetings in November 2015. September
2017 was the month the suspicious purhchase was recorded as described earlier.
<img border=0 width=1139 height=854 id="Picture 8"
src="VA_Assign_VAST_MC3_files/image008.jpg">

Whole period (2015-2017)
The figure above shows the connections between employees during the whole
period (May 2015 - Dec 2017). The ID of the 20 suspicious employees are
labelled. As discussed earlier, ID 1847246 (Rosalia Larroque) who made a
suspicious purchase and ID 728286 (Kerstin Belveal) made phone calls to each
other frequently thus connected
by light blue edge. The other suspicious employees are mostly connected with
each other as well by blue edges which means fewer phone calls. ID 857138 (Richard Fox) is connected with the most nodes
(has the largest degree), thus appears to be relatively higher position such as
a manager. It is assumed that most of the suspicious employees, including ID
1847246 (Rosalia Larroque) and ID 728286 (Kerstin Belveal), report to ID
857138 (Richard Fox).
The figures that show connections in each
month follow.
<img border=0 width=1024 height=768 id="Picture 9"
src="VA_Assign_VAST_MC3_files/image009.jpg">

Oct 2015
<img border=0 width=1024 height=768
id="Picture 10" src="VA_Assign_VAST_MC3_files/image010.jpg">

Nov 2015
<img border=0 width=1024 height=768 id="Picture 11"
src="VA_Assign_VAST_MC3_files/image011.jpg">

Dec 2015
<img border=0 width=1024 height=768 id="Picture 12"
src="VA_Assign_VAST_MC3_files/image012.jpg">

August 2017
<img border=0 width=1024 height=768 id="Picture 13"
src="VA_Assign_VAST_MC3_files/image013.jpg">

Sep 2017
<img border=0 width=1024 height=768 id="Picture 14"
src="VA_Assign_VAST_MC3_files/image014.jpg">

Oct 2017
There were numerous connections between the suspicious employees in November
2015, followed by September 2017, while not so much in the other months.
<img border=0 width=1124 height=441 id="Picture 7" src="VA_Assign_VAST_MC3_files/image015.jpg">
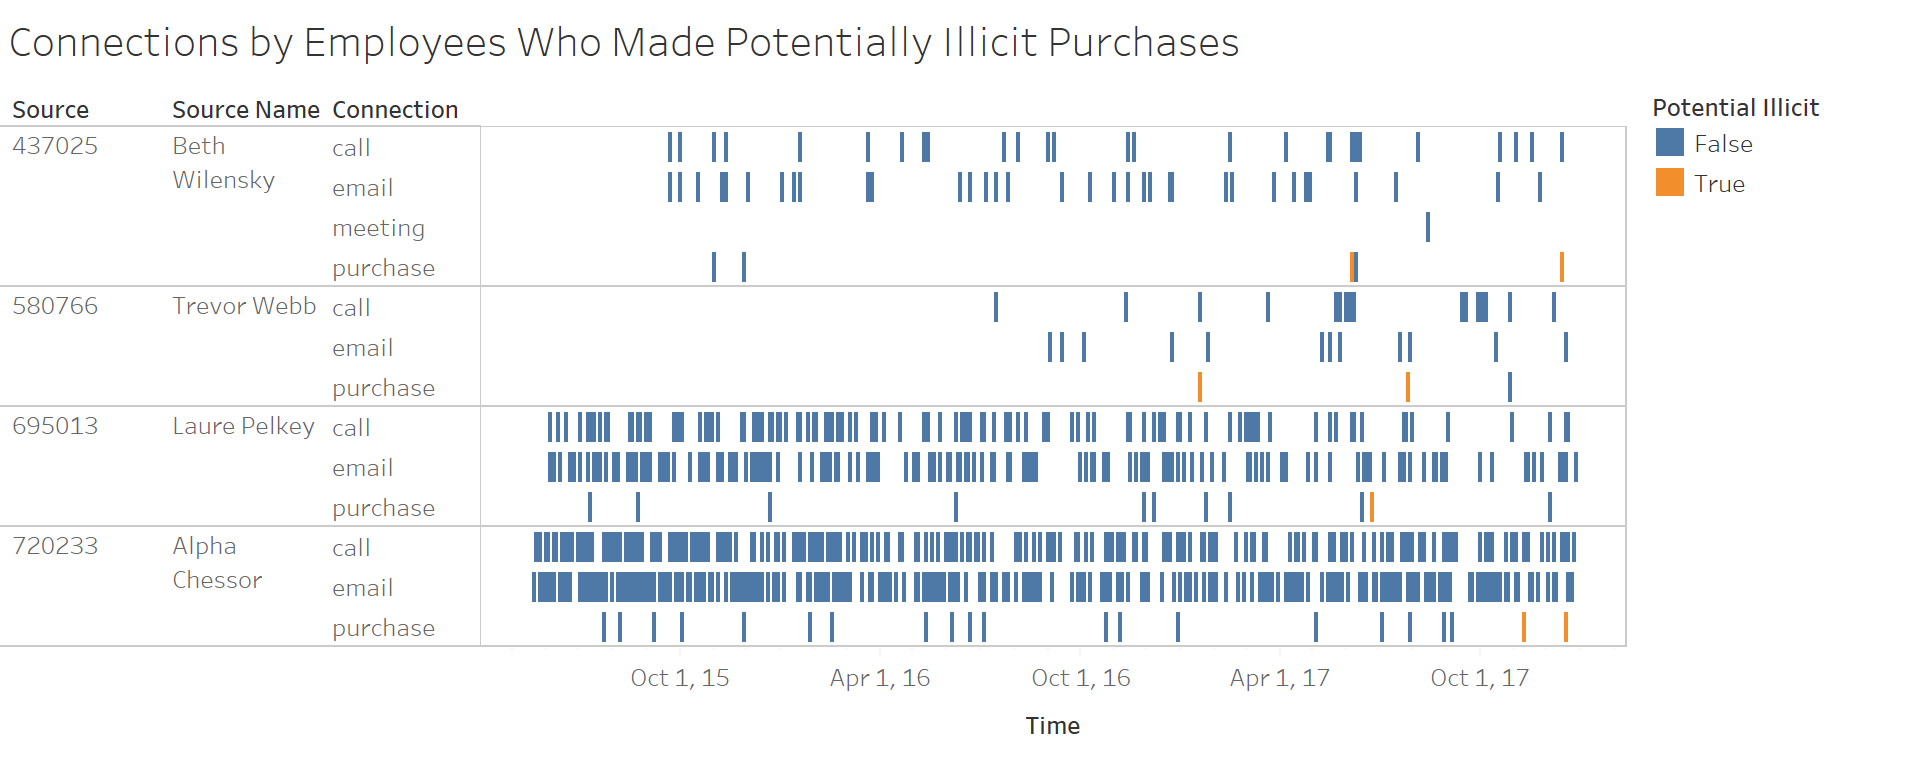
The figure above shows the connections made by the 4 employees who made potentially illicit purchases. The potential illicit purchases were highlighted by orange color above.
<img border=0 width=1109 height=459 id="Picture 19" src="VA_Assign_VAST_MC3_files/image016.jpg">
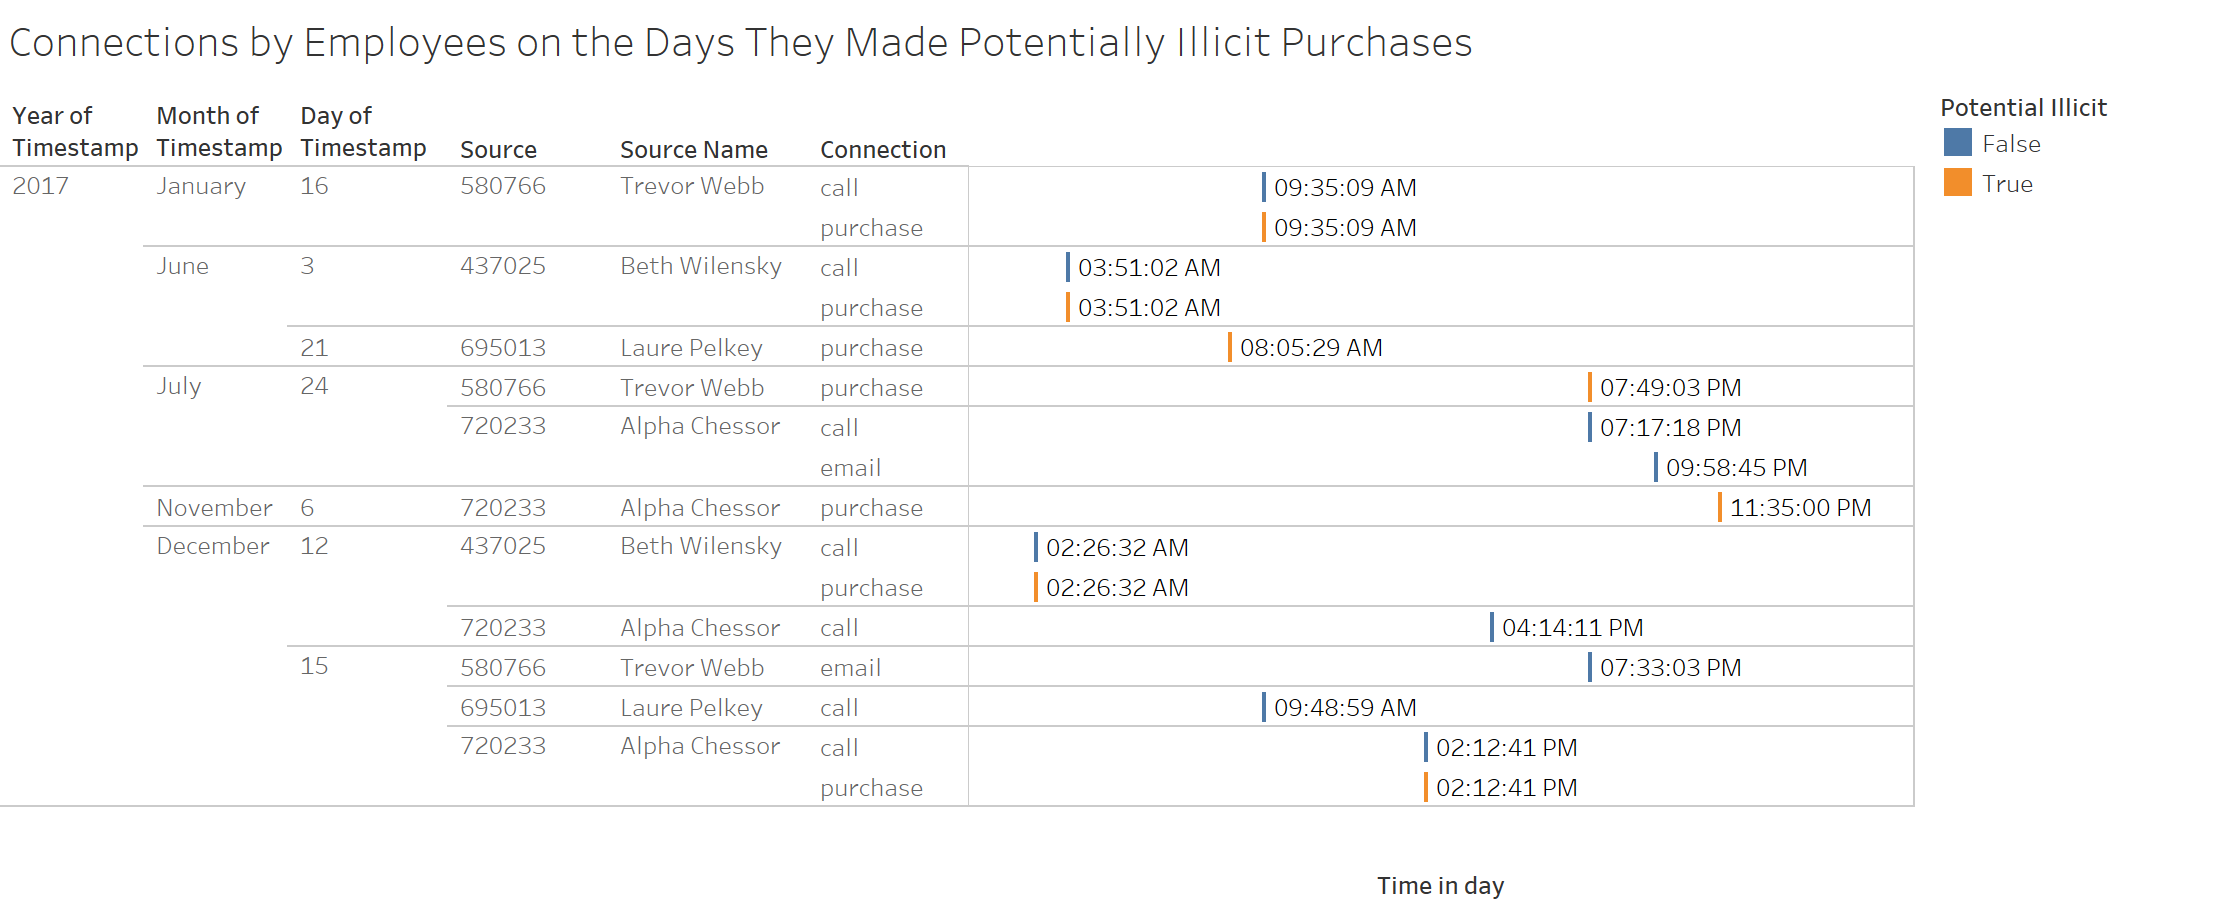
The figure above zoomed in the days on which the employees made potentially illicit purchases. 4 out of 7 potentially illicit purchases occurred together with phone calls

