ISSS608 2017-18 T3 Assign Joel Choo Peng Yeow Company Growth
"You See, But You Do Not Observe"
- Sherlock
Looking Deeper Into The Network Of Connected Individuals
|
|
|
|
|
|
|
Contents
Kasios International - Have You Grown?
Overview
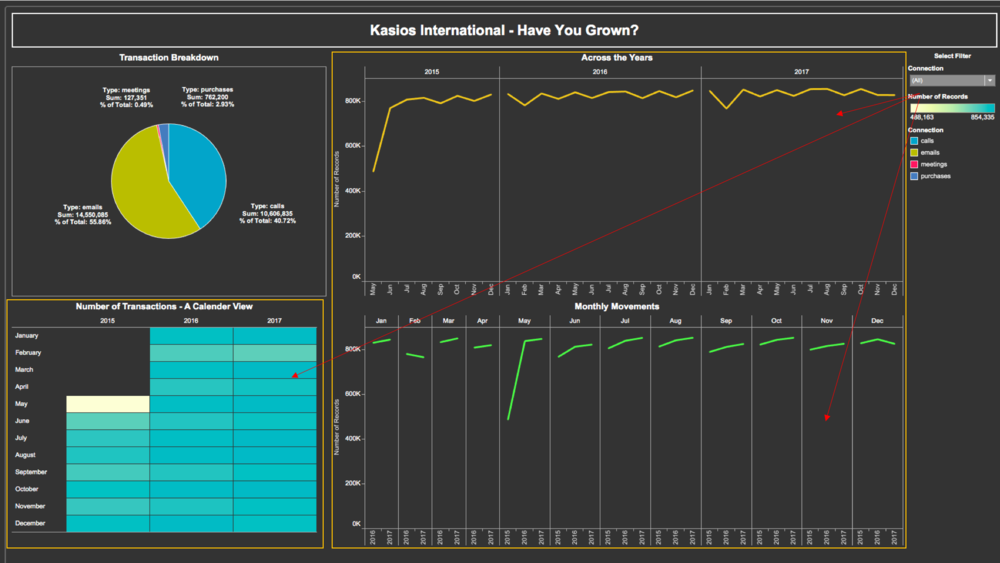
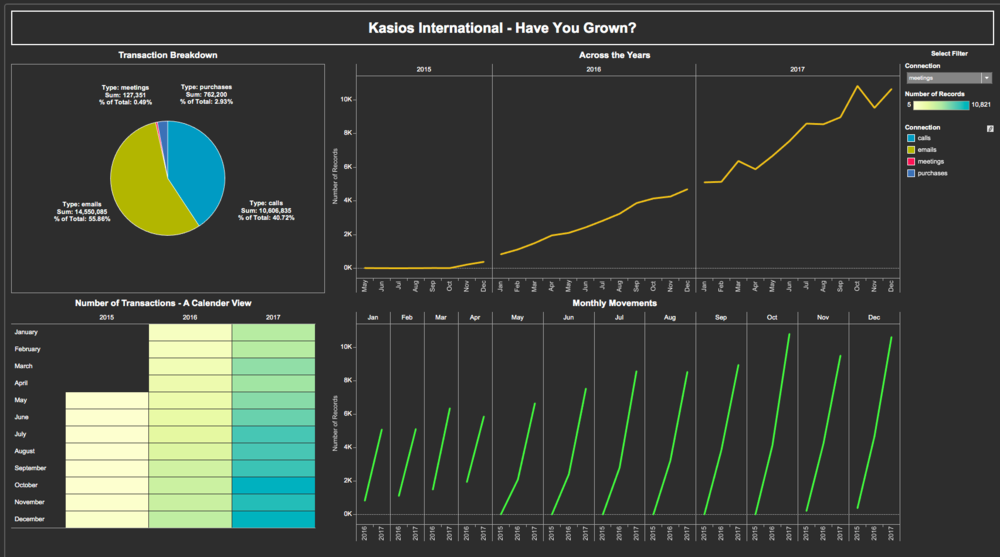
With an interactive dashboard constructed in tableau, we would like to find out if the company is growing and have they changed over time. According to the company’s communications and purchase habits, we will investigate the overall transactions across time and also its respective breakdown by Calls, Emails, Meetings & Purchases.
The dashboard consist of 4 components, selecting the filter will however only change 3 of the graphs indicated below. As of today, there have been around 26 million transactions and majority of then comes from emails (55.86%) and calls (40.72%). In its first month, there have been lesser records and when June came, the number of records have spiked and remain steady ever since. In terms of growth, they have probably retained the same number of headcounts since 2015.
Interestingly, when we look at the monthly movements graph, May was the only month where there have been a spike between 2015 and 2016.
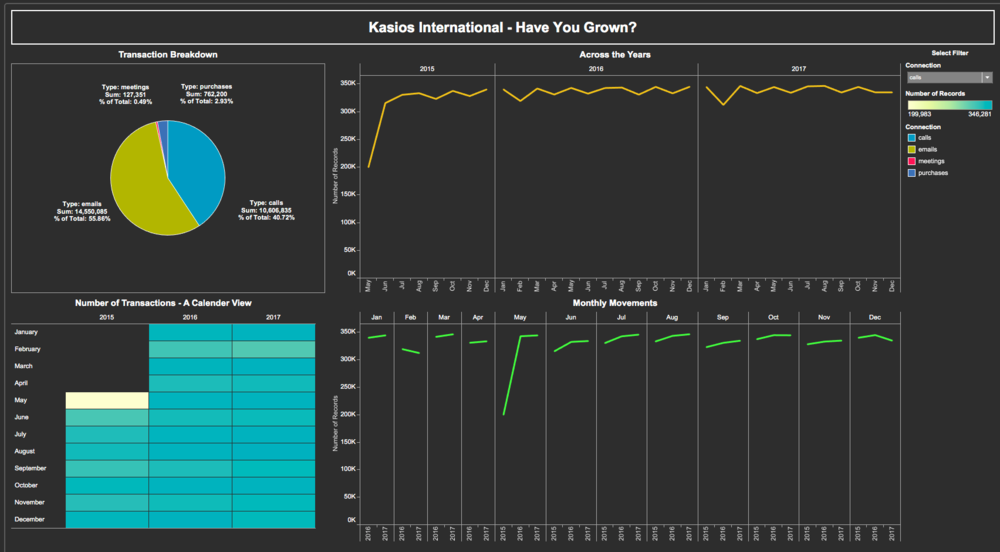
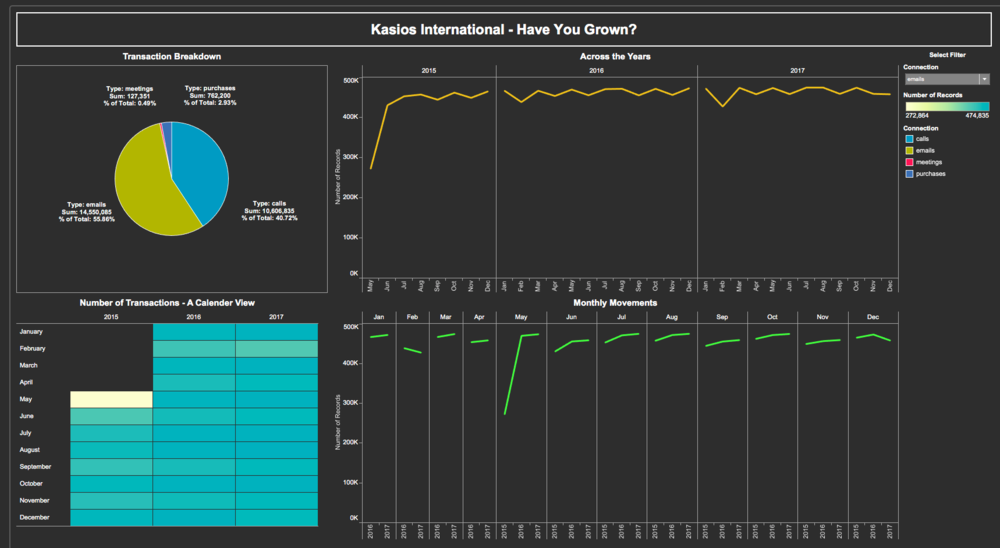
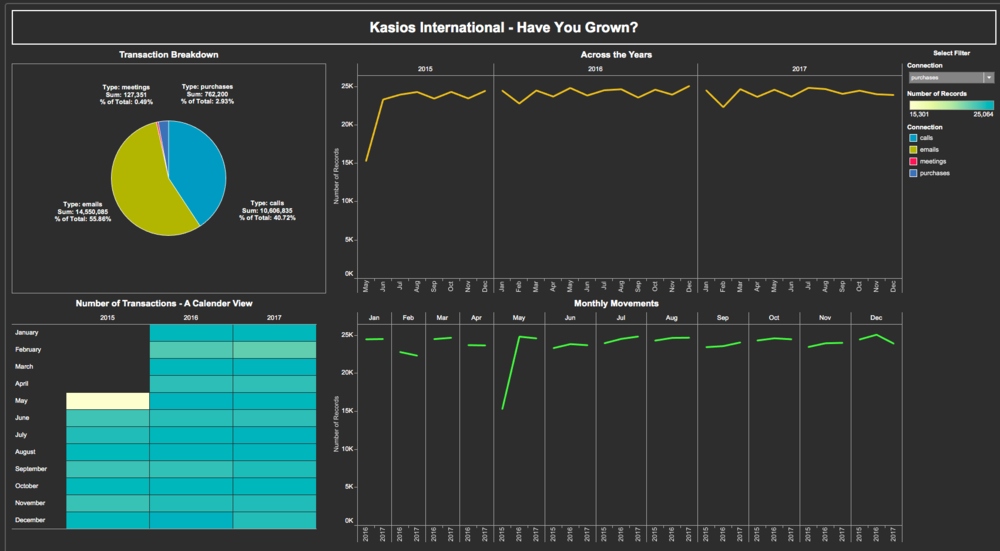
Breakdown: Calls, Emails & Purchases
Calls and emails have identical trends compared the overall company’s records. This is not surprising since they make up the bulk of the records.
As for purchases, they too have the same trends as the overall company’s records and have not seen a significant increase in purchases since June 2015.
Breakdown: Meetings
There have been an exponential increase in the number of meetings held in the organisation. In May 2015, they started out with only 15 meetings in the month and have climbed to an astonishing record of 10,633.
Monthly movements across the years are similar across the months.
Summary
An increase in meetings might be an indication of improved collaboration and communication within the organisation. However, the overall number of records, calls, emails and purchases show a stagnant trend ever since June 2015 and Kasios International is unlikely to have grown in size.

