ISSS608 2017-18 T3 Assign Luo Haoran Q2 & Q3
Revision as of 22:00, 8 July 2018 by Haoran.luo.2017 (talk | contribs)
|
|
|
|
|
|
What did the insider tell?
Suspicious People

The insider has already named 20 employees to be suspicious.
The investigation should start from the people on the list.
- 1. Find Their Events
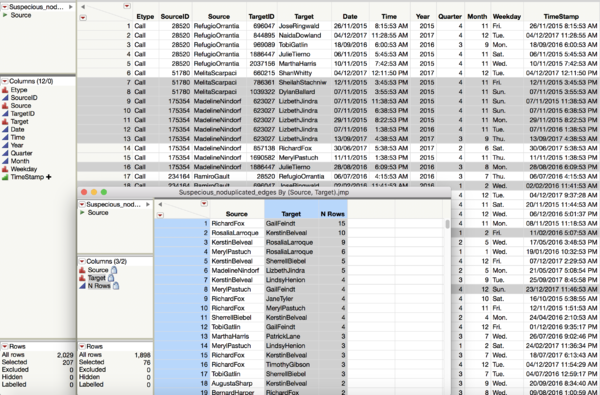
- JMP generated all the events involving those 20 people. There are more than 2000 events. However, the interactions that happened for only one time look not very suspicious. Events happened more than once should be dug deeper.
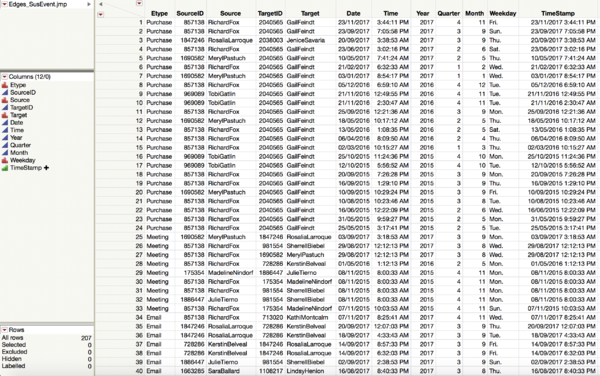
- 207 interactions are left and they are the edges data for social networking analysis.
- 2. Find All People Involved
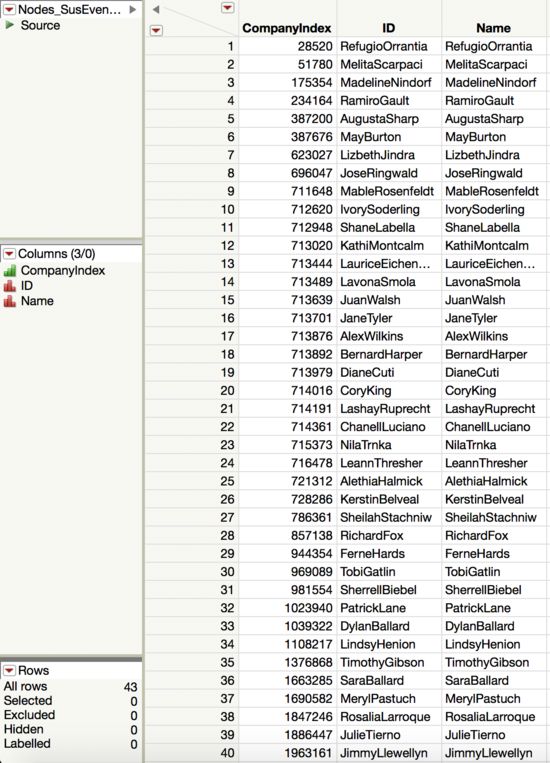
- Among the 207 events, 43 people are located. They are the nodes for launching social network analysis.
What are their interaction?
1. Social Network Diagram
- Using the edges and nodes generated in previous step, social networking analysis can be launched.
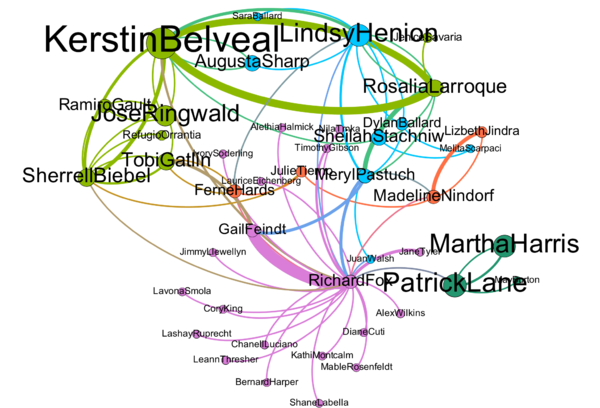
- In this diagram, color tells the group the person belongs to. It is realised by Modularity calculation. Nodes having density connection will be grouped into the same modularity. And the size of nodes indicates the importance of the person. It was generated by PageRank, an algorithm to calculate the importance level.
- Findings:
- Five different groups are categorized. Purple group is the largest one while dark green group is the smallest.
- The interaction between green group and blue group is the most frequent.
- In terms of the interaction within the group, purple group is radial while green group and blue group are intertwined.
- Kerstin Belveal in green group has the largest size of dot but relatively less edges, which indicates that the people Kerstin contacts are with higher importance.
- Richard Fox has the most edges. However, his node size is not big.
2. Dynamic Display
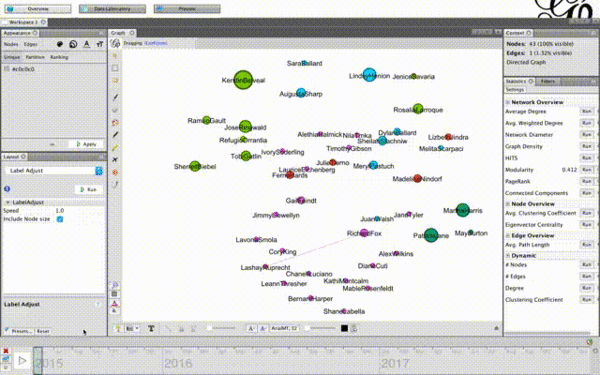
- As for the change over time, the animation below reveals some interesting points.
- Purple group was the first group formed. Green group and blue group formed later.
- Richar contacted Gatlin very frequently in the second half year of 2017. But the connection not mutual. Gatlin never reached out to Richard.
- Events between Kerstin and Rosalia becomes more frequent from the last quarter of 2017.
Is there any pattern?
Abnormal Events
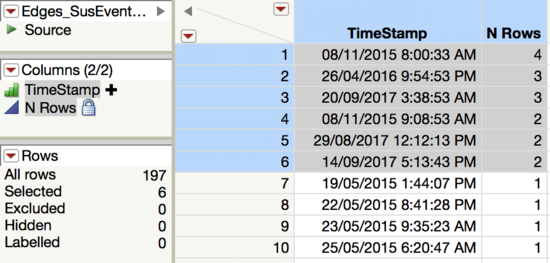
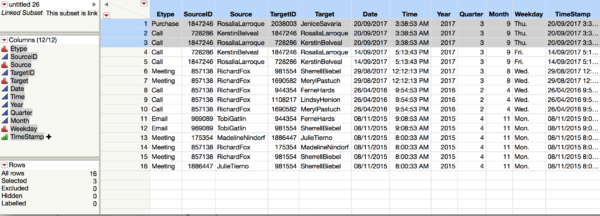
Grouping only by TimeStamp, there are 16 events. Some of them happened as the same time. A few events draw attention.
The calls between Rosalia and Kerstin were special. They are the destination/target of each other. This did not happen in any other employees.
So this could be a potential pattern.
