ISSS608 T3 ASSGN1 PRIYANKA EDA
|
|
|
|
|
|
|
Exploratory Data Analysis
To investigate the given case, the following Exploratory Data Analysis has been conducted using Tableau:
Question 1
Characterize the past and most recent situation with respect to chemical contamination in the Boonsong Lekagul waterways. Do you see any trends of possible interest in this investigation?
An Exploratory Data Analysis on the given dataset reveals the following trends:
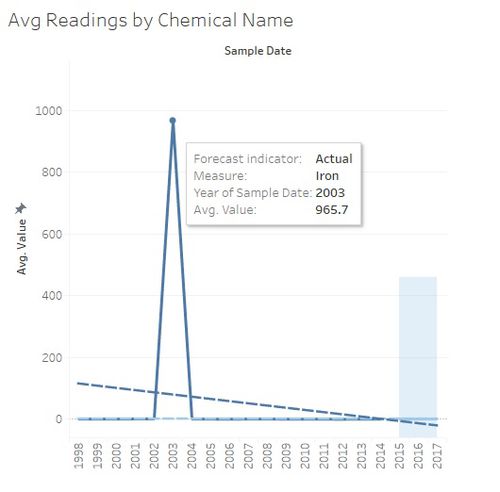
1. Suspicious Spike in Iron level
Although the level of iron is consistently reducing over the years, there has been an unexpected spike in the level in 2003, with the chemical level reaching as high as 965.7 mg/l, as shown in the figure below.
The reason for this must be investigated to identify any possible chemical contamination in the waterways durin the period.
2. Frequent Spikes in Total Coliforms
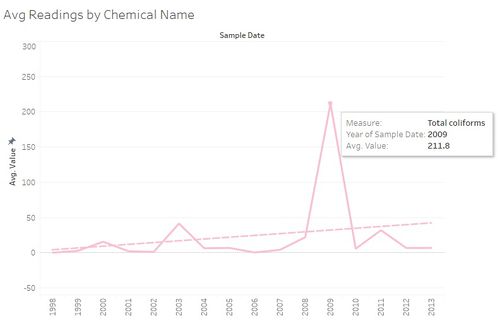
Looking at the patterns for Total Coliforms, we see frequent spikes in the reading in the years 2000, 2003, 2009 and 2011, with the highest reading recorded as 211.8 mg/l in 2009. The trend line indicates that the amount of this chemical is gradually increasing in the waterways & hence steps need to be taken to keep the readings under check.
3. Consistent high levels of Bicarbonates & Total Dissolved Salts
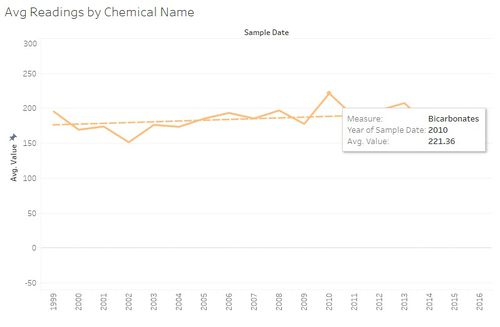
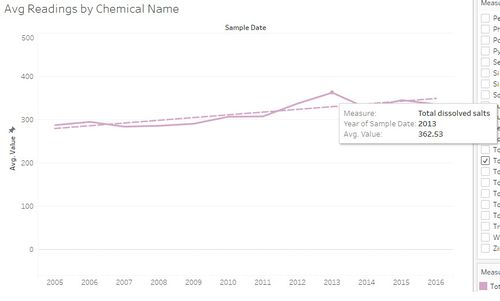
Total dissolved salts & Bicarbonate levels have been consistently high in the samples collected over the years. The trend line indicates that the level of these chemical is gradually increasing in the waterways & hence needs further investigation.
4. Drastic increase in Methylosmolene
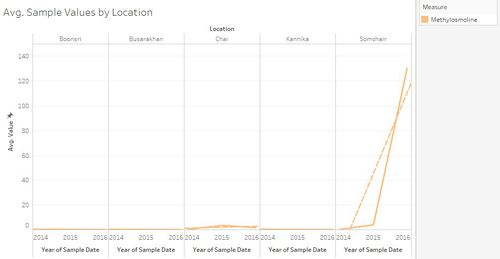
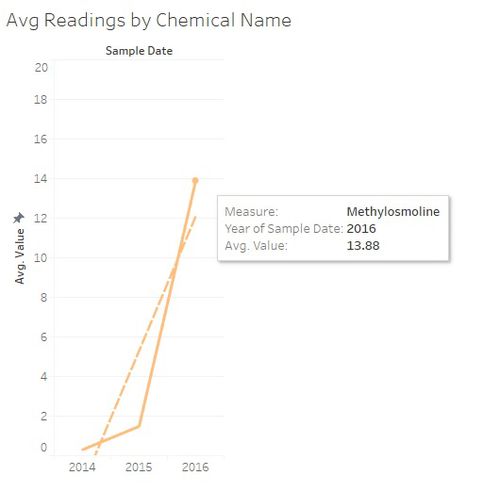
The levels of Methylosmolene (the toxic manufacturing chemical in the suspected dumping) has drastically increased over a period of 3 years, as shown below:
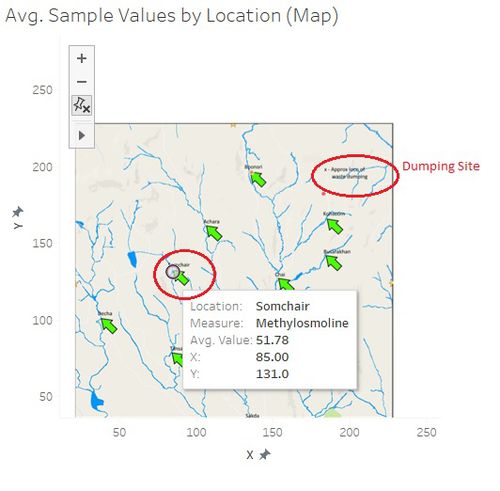
A closer analysis reveals that the levels are very high in Somchair, which although is not near the dumping site but still needs further investigation.
5. Suspicious spikes overall chemical levels in 2003
An anlysis of the overall chemical levels across locations reveals that there are suspicious spikes in the overall chemical levels across locations in 2003, as shown below.:
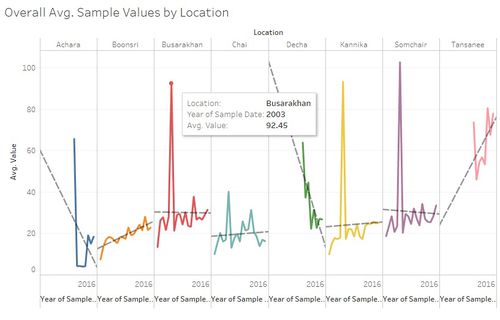
Further, the chemical levels at Tansanee have been rising unexpectedly in comparison to other locations which needs to be examined.
Question 2
What anomalies do you find in the waterway samples dataset? How do these affect your analysis of potential problems to the environment? Is the Hydrology Department collecting sufficient data to understand the comprehensive situation across the Preserve? What changes would you propose to make in the sampling approach to best understand the situation?
The following charts represents the pattern of data collection of some of the chemicals over the years:
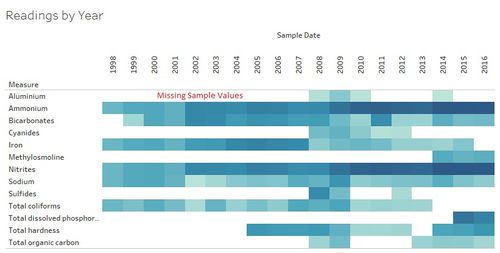
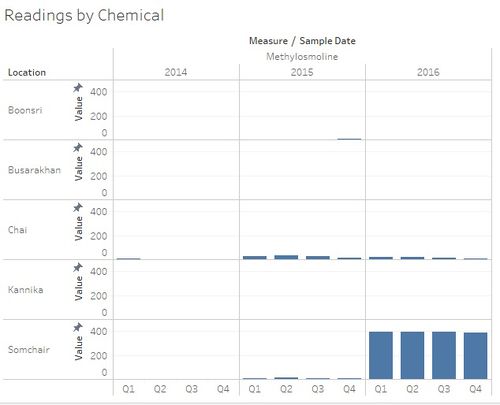
Looking at the above pattern of data collection, we can conclude the following:
1. The data samples have been collected randomly.
2. There are missing values of readings for some of the chemicals.
3. There is inconsistency between samples of same chemical collected during the same period across different locations
For instance, if we see observe the trend for Aluminium, the sample has only been collected from 2008 onwards and there are gaps in the data between 2011-2013.
The sample of the chemical in question - Methylosmolene - has been collected only during the past 3 years and there are no readings prior to this period.
The chart also shows that the number of samples collected over the years is not consistent, as indicated by the gradient color.
Also, if we look at the second chart above, we see that the Methylosmolene samples collected during the same Quarter of the year across different locations are not consistent. For example,In 2015, the samples were only collected in Q4 in Boonsri, in locations like Chai and Somchair, the samples were collected for all Quarters while in Busarakhan and Kannika, no samples were collected at all. Similary in 2016, we can observe a huge difference in the number of samples collected in Chai & Somchair.
The above highlighted anomalies affect the data analysis of the potential problems to the environment.
Since the samples are collected randomly and there are missing values, it becomes difficult to come up with the trends in the change of these chemicals over time. To be able to interprete the data correctly and with accuracy, it is important that we have a consistent patter of collection of all the samples across all the locations and time.
It is hence suggested that the hydrology department establish a fixed schedule of data collection across all locations to ensure that the data collected is as accurate as possible and is free from any missing information. It should be noted that some chemicals may vary in composition across different times of the year and hence to ensure correctness of the analysis results, all samples must be obtained/collected at the same time.
Question 3
After reviewing the data, do any of your findings cause particular concern for the Pipit or other wildlife? Would you suggest any changes in the sampling strategy to better understand the waterways situation in the Preserve?

