ISSS608 2017-18 T3 Assign Yeo Kaijun Findings
|
|
|
|
|
Q1: Characterize the past and most recent situation with respect to chemical contamination in the Boonsong Lekagul waterways.
Comparison across time
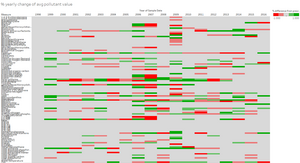
As observed in Img 1, there appears to be no obvious trends in terms of % yearly change of pollutants value. There is no consistent increase or decrease over the years as observed from the mix of red and green cells across the years. However, it appears there to be sharp increase and decrease in terms of pollutant values as observed from the bright green or red respectively. Further analysis is done for each pollutant that has sharp changes in recent years to understand the location that has contributed to these changes. The below mentioned trends had been observed
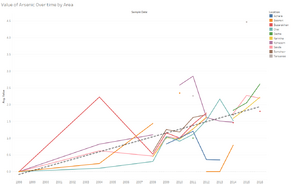
1. Increase in Arsenic values over the years
As observed in Img 2, even though there had been sharp increases and decreases in arsenic level over the years, as shown by the dotted trend line, arsenic value had on average been increasing over years. Arsenic value in Tansanee had spiked considerably as its value increased from 2.26 ug/L in 2011 to 4.468 ug/L in 2015. Despite the sharp increase in arsenic level, it is important to note that arsenic values are still way below US National Recommended Water Quality Criteria for aquatic life ambient.
2. Atrazine values had spiked during 2008 - 2010 for all waterway sensor sampled
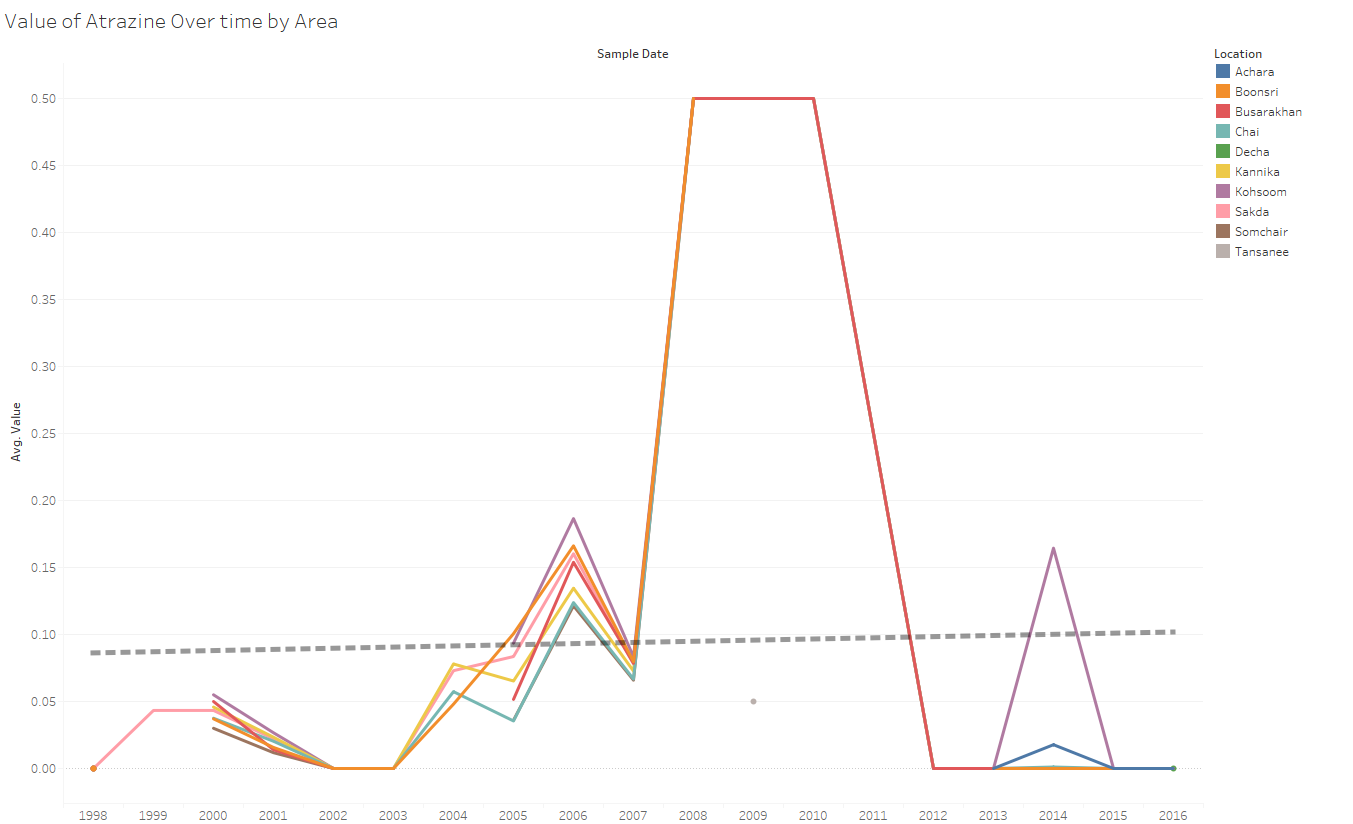
As observed in the above image, atrazine levels have consistently spiked across all the locations where readings are available from 2008 to 2010. This pattern seen across all the locations should be investigated further for the root cause.
3. Petroleum hydrocarbons values had spiked during 2012 for all waterway sensor sampled other than Boonsri
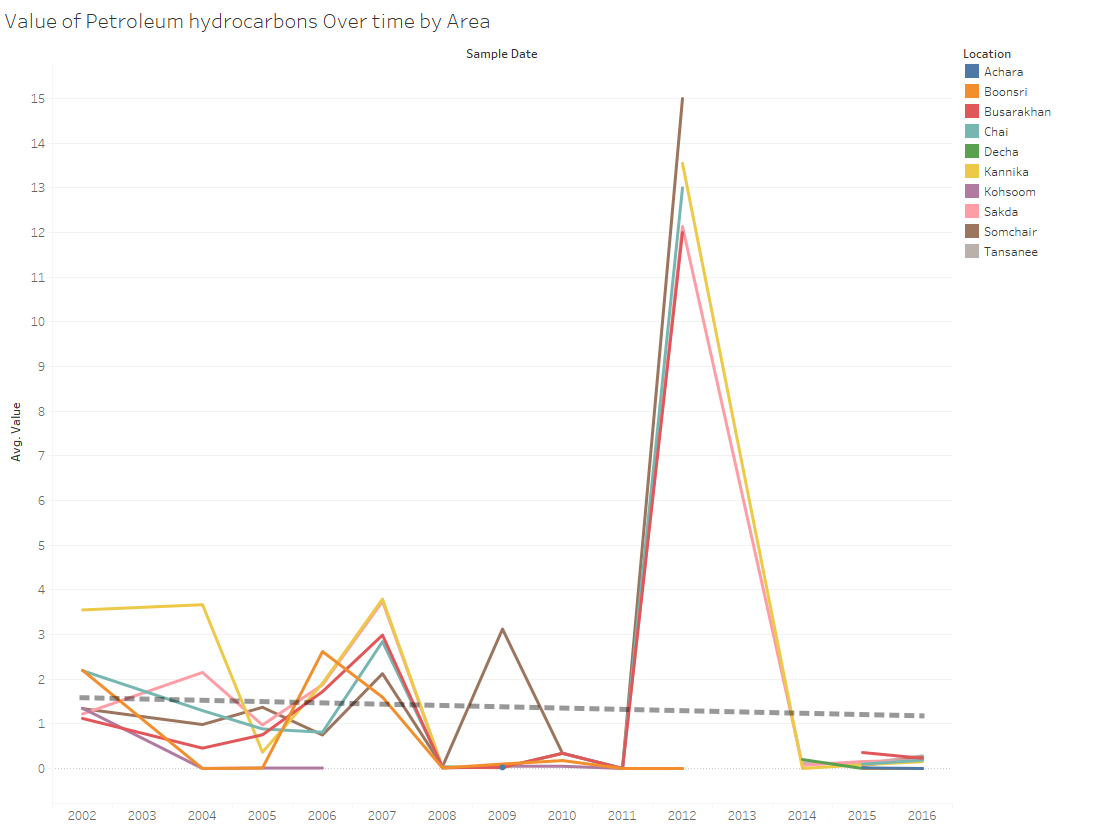
As observed in the above image, petroleum hydrocarbons levels have spiked across all the locations where readings are available, other than Boonsri in 2012. This pattern seen across all the locations should be investigated further for the root cause.
Comparison with a standardized water quality criteria
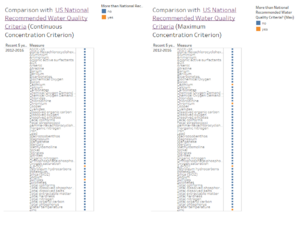
In Img 5, values that are above the US National Recommended Water Quality Criteria for aquatic life ambient are indicated in orange. As observed, there are main measures that are above the criteria (Cadmium, Chromium, p,p-DDT, Sulfides and Zinc). Further analysis would be done to pinpoint the location/time where the criteria was exceeded
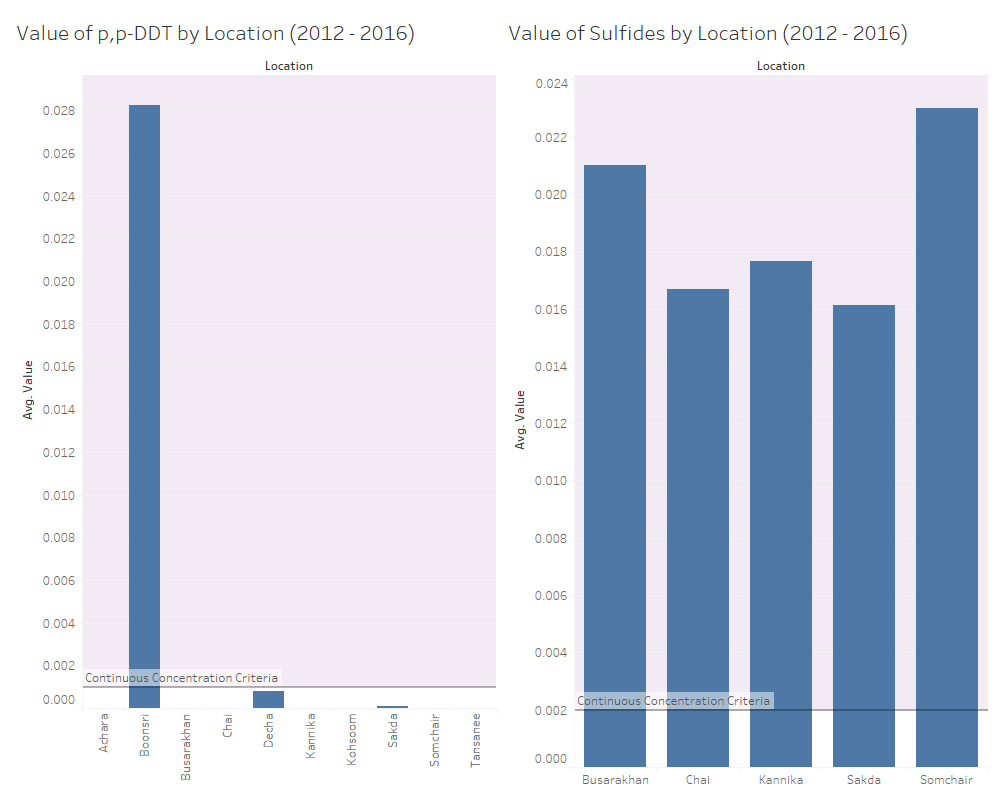
Firstly, we look at the measures that exceed the continuous concentration criterion. As observed in the image above, for p,p-DDT, only Boonsori is higher than the continuous concentration criterion. Although, it might seem that this high value of p,p-DDT could be due to the waste dumping due to Boonsori being near to the approx location of waste dumping, it seems weird that Kohsoom which is also near to the location did not observe such trend. More evaluation is needed to pinpoint the reason behind the high value of p,p-DDT at Boonsori.
On the other hand, sulfides values are higher than the continuous concentration criterion in all locations sampled. However, it is important to note that there was no values sampled at the 2 leftmost waterways (Decha and Tansanee). More samples might be needed to be conducted at the 2 leftmost waterways to check whether this high sulfide value could be the natural state of water around this region.
Next, we look at the measures that exceed the maximum concentration criterion.There are 2 main concerns observed:
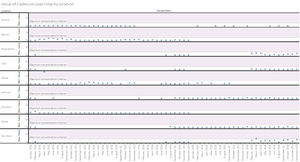
1. Cadmium values at Somchair had been high in recent years
As observed in Img 7, although only one data point exceeded the maximum concentration criterion, it can be observed that Somchair's Cadmium value had increased from 2014 and most of the monthly maximum values of Cadmium had been bordering around the maximum concentration criterion.
2. Zinc values at Decha had been high across years
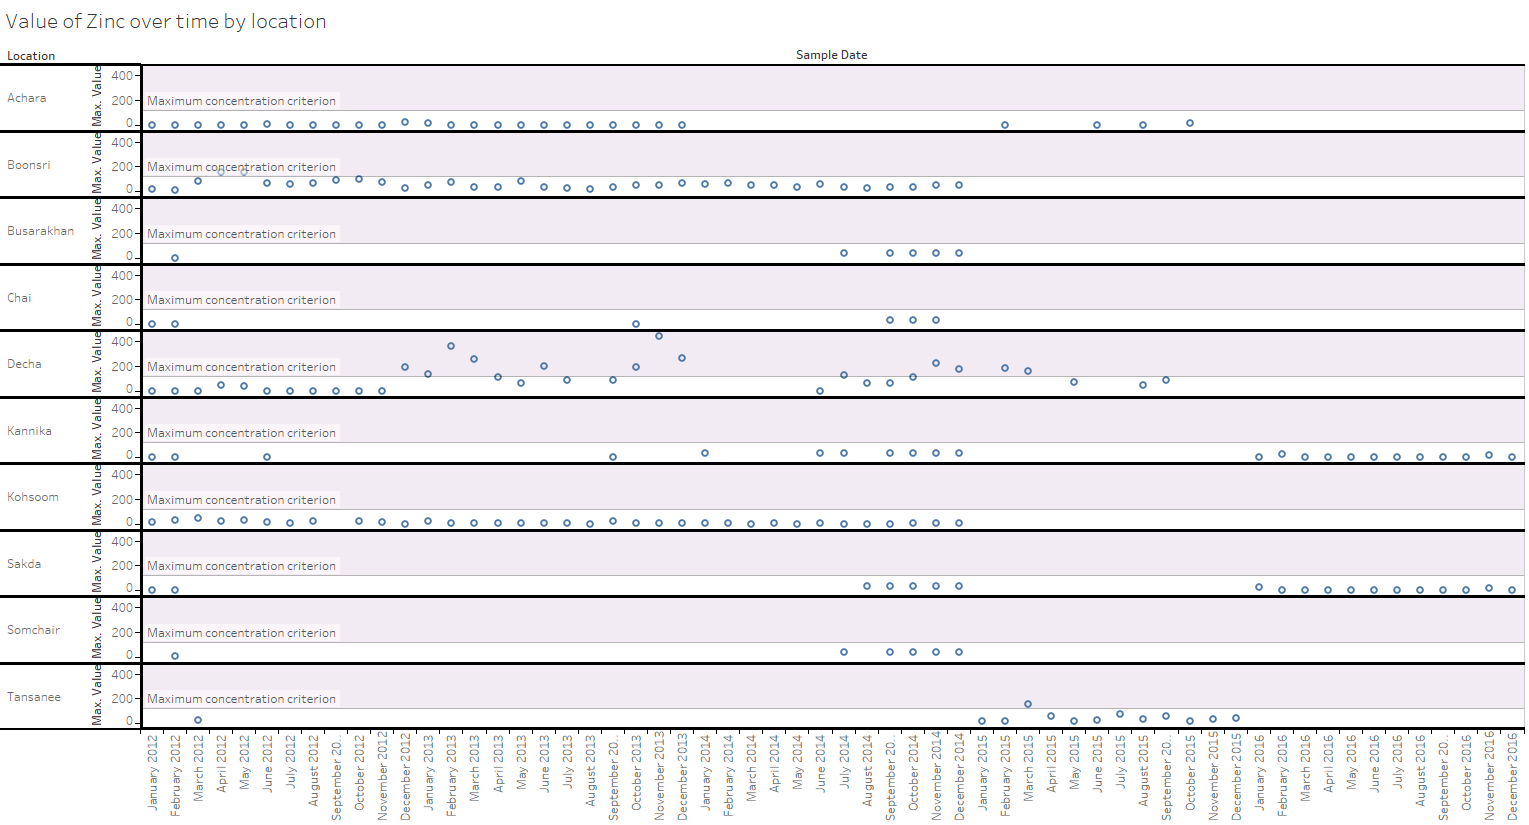
As observed from the image above, Decha's Zinc value had remained consistently high from 2012 to 2015 and would definitely be a case of concern.
There had been no samples done in 2016, thus making it impossible to evaluate after 2015. Zinc content at Decha should be monitored closely to ensure that the value keeps to an acceptable level.
Insights on Methylosmoline
As Methylosmoline is the toxic manufacturing chemical in the suspected dumping, further insights are obtained for this measure.
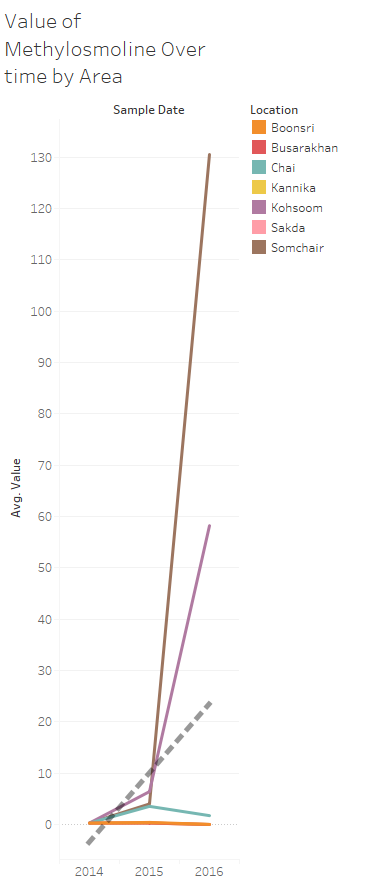
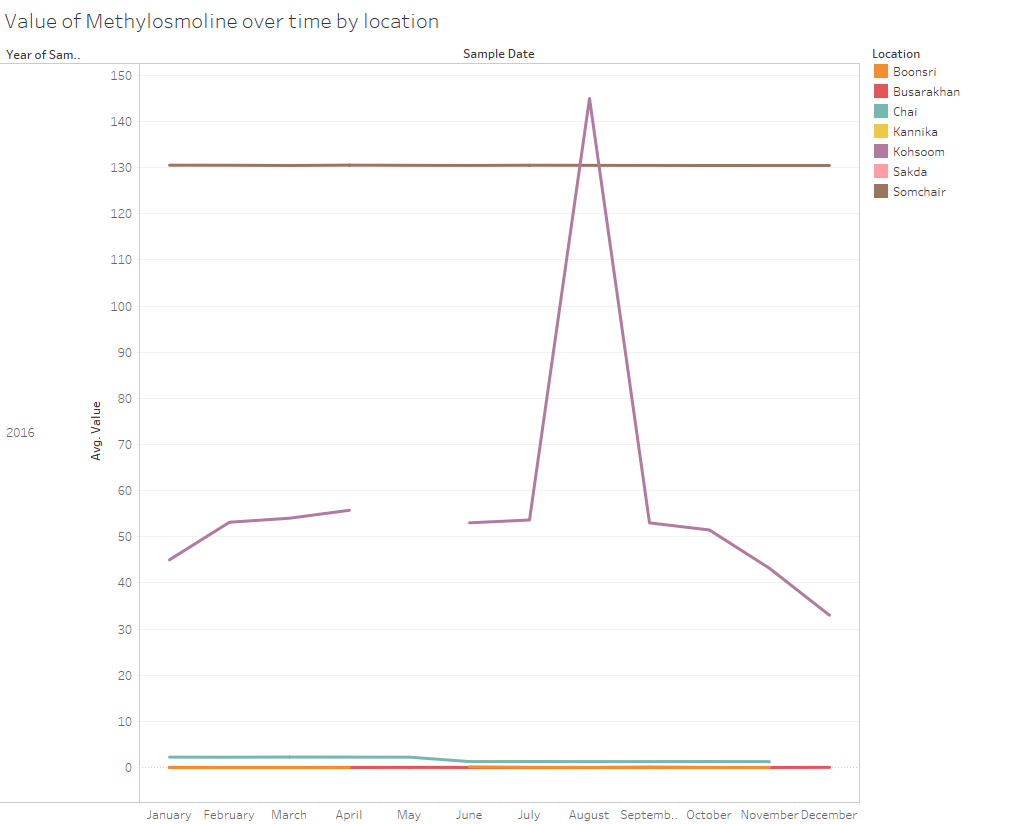
From the image above, it can be observed that value of Methylosmoline has spiked in 2016 for 2 locations (Kohsoom and Somchair). As Further analysis shown in the image below shows that the spike in Methylosmoline is during the month of August. As Kohsoom is near to the suspected location of dumping, it could be possible that chemical dumping did take place in 2016.
Q2a: What anomalies do you find in the waterway samples dataset and how do they affect my analysis of potential problems to the environment?
There are 3 main anomalies found in the waterway sample dataset:
1. Minimal waterway sensors for certain waterways
2. Source of pollutant dump not confirmed
3. Inconsistency in data collected
1. Minimal waterway sensors for certain waterways
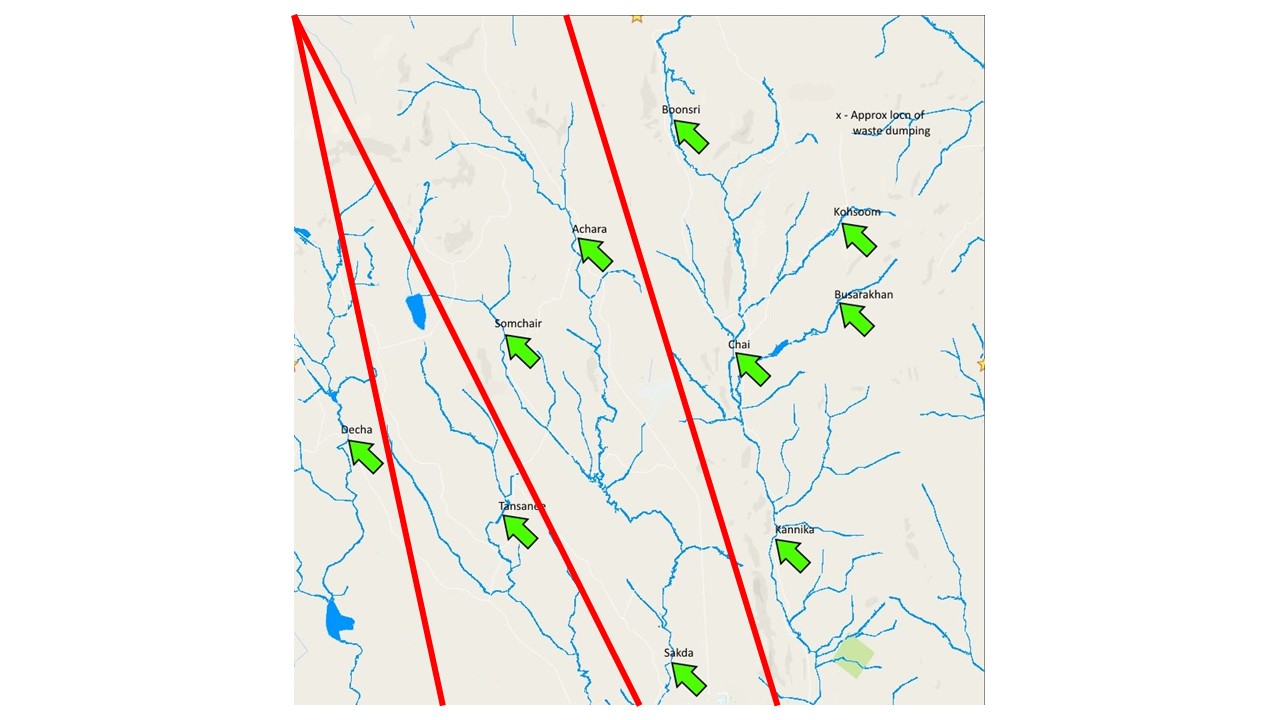
As observed in the image above, the 2 leftmost waterway only have 1 sensor each, which is much less compared to the number of sensors in the other 2 waterways (3 & 5). With minimal sensors in the 2 leftmost waterway, there is a possibility that any analysis of the waterway health for these 2 waterway might be misleading as there is no possibility of comparison with the upstream or downstream water quality for these waterways.
2. Source of pollutant dump not confirmed
As observed in the map above, only a approximate location of waste dumping is pin pointed. No confirmed location is provided.
3. Inconsistency in data collected
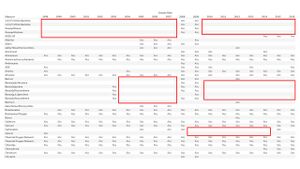
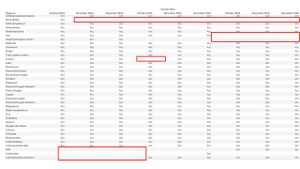
Img 10, 11 and 12 are examples of inconsistency in data sampled.
Img 10 shows that there are some measures that do not have any values recorded in certain locations. This indicate that we might be missing insights on certain measures for some locations. Some measures might also only be sampled in a few locations, thus making it tough to analyze the data collected as we are unable to compare the sample collected with different locations of the reserve.
Img 11 shows that there are some measures that are not sampled in certain years. There are some issues that comes along with this:
1. We are unable to compare how certain measures varied over the years for measures with only data for a few years
2. We will be unable to know the current situation for measures who are missing recent data
3. Analysis of the measures over time might be misleading.
Img 12 shows that there are some measures where the month of data collected varies across years (E.g. for arsenic, there are values collected in Oct 2014 and 2016 but no values collected in Oct 2015. This might result in misleading analysis as there might be spikes in arsenic values every Oct and missing out Oct 2015 values might result in a sudden decrease in arsenic values when we are evaluating measures on a yearly basis.
As mentioned in part 2(a), the hydrology department is not collecting sufficient data. Some changes to be suggested are:
1. Increase the number of sensors in the 2 leftmost waterways
2. Confirm the site of dumping to ensure more accurate evaluation
3. Ensure consistent sampling periods
4. Ensure consistent measures sampled across location
Firstly, Methylosmoline the suspected chemical dumped has spiked considerably in year 2016 in 2 locations, Somchair and Komsoon, with Komsoon having an exceptionally high level of Methylosmoline of 145 ug/L at Aug 2016. Suspected dumping might have occurred in these 2 locations during 2016.
Secondly, the average sulfides value for 2012 - 2016 is above the US National Recommended Water Quality Criteria for aquatic life ambient in all locations sampled. It might be important to look into the high sulfides level to ensure that it is not due to unnatural causes and would not harm the wildlife around it.
Another point to note is that for the most recent samples, Zinc values in Decha, Cadmium values in Somchair appears to had increased and most samples are bordering around/above the US National Recommended Water Quality Criteria for aquatic life ambient.
Lastly, it can be observed that extreme spikes in values of measures could be seen in different locations over time (e.g. The case of Atrazine and Petroleum hydrocarbons shown in Q1). These spikes do not appear to be natural and unless valid reasons could be provided should be looked into.
The suggested changes in sampling is mentioned in Q2b
Back to Assignments
