Is this company growing(2015-2017)
|
|
|
|
|
Viz & Insights
Deep Exploration
| Figure | Insight |
|---|---|
| 2.Changing with the location?
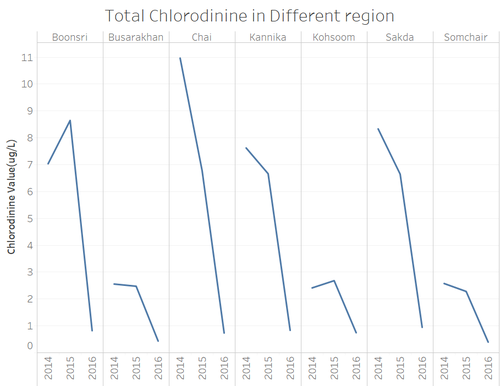
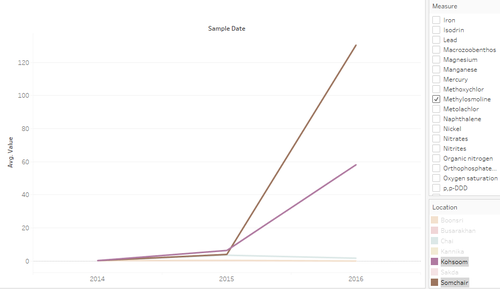
For Chloridinines:In Chai, it drop steeply and in Kannika and Sakda, it drop slowly then drop steeply, and in Busarakhan and Somchair, it’s more or less the same trend, and in Boonsri and Kohsoom, 2014 value is higher lower than 2015, then both drop sharply. They both reached the low point in 2016. For Methylosmoline:In Boonsri, Busarakhan, Kannika and Sakda, the value is very small, but in Chai, 2015, the value is higher, and for Kohsoom and Somchair , it sharply increased in 2016. |
Chloridinine [1]: Methylosmoline [2]: |


