Data Preparation
|
|
|
|
|
Contents
Data Description
The data available for the assignment is shown in detail below:

Tools Used
Below are the tools used for the Data analysis and visualization for this assignment:
1. SAS JMP Pro 13
2. Microsoft Excel
3. Tableau
Data Preparation
The data given in the vast challenge need to be merged and prepared before performing the analysis in the tableau for visualization. The data preparation needed was broadly classified into three steps merging the input files, cleaning the data and mapping the Geolocation for the sites in the preserve.
Data Consolidation
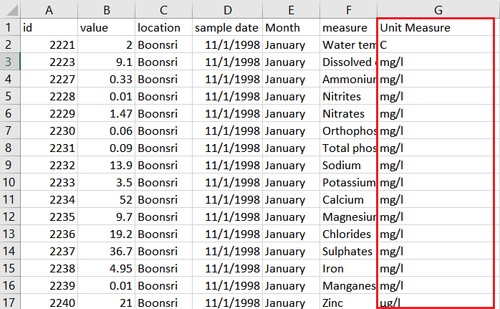
The data files given for the vast challenge has two excel files named chemical units of measure and Boonsong Lekagul waterway readings. The chemical units of measure had the unit as each chemical has different measuring scale. As a first step the two excel files has been merged using lookup of the chemical name in excel and merged as shown below:
![]()

Data Cleaning
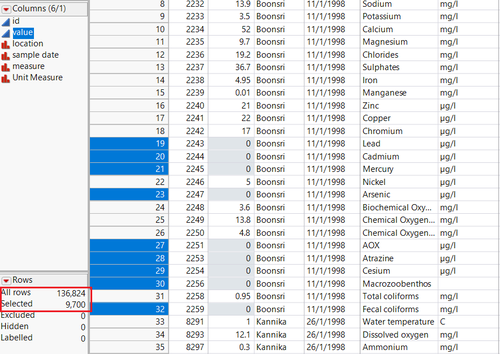
Looking at the data after merging, the chemical measure value had many chemical readings value as 0.0 as these records are equivalent to not having the chemical contamination in the location, these records need to be deleted before the data analysis for better visualization. Nearly 2.5 percentile records about 9700 rows have value has 0 as shown below:


GeoLocation Mapping
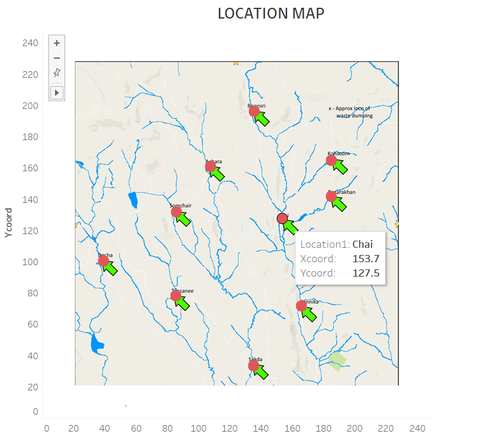
A new excel file is created with all the location names under the column Location and two new coordinates X and Y empty. The lower and upper limits for left and right, bottom and top in the values as 0 and 249 are defined. Taking the excel file in tableau as data source, the background image is inserted in tableau as the Waterway image given in the data. Each of the location is annotated in tableau to find the X and Y coordinates for every location. The values are traced back and manually input in the initial data file to map in tableau each location. This is necessary to locate the regions in tableau. after the reverse Geocoding, the tooltip shows the location coordinates with respect to other location.
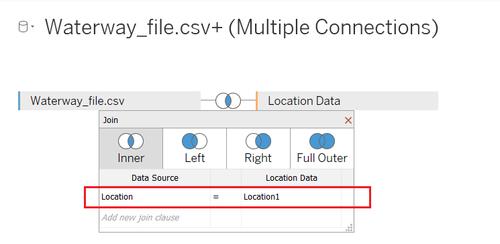
In tableau after the above step the initial excel file prepared and the location file created from Geolocation mapping is joined using inner join with the key column as Location so that the file for visualization has the coordinates of the locations in the map.


