ISSS608 2017-18 T3 Assign Hasanli Orkhan Insights
 Detecting Suspicious Individuals
|
|
|
|
|
Changes over time in the company

By looking at the overall trend we can compare absolute numbers and see that during 2.5 years the number of Emails always were higher than other communication types and average number of emails was 462K, whereas Calls which following the Emails on average showing 336K throughout the period. There is some obvious fluctuations depending on number of days in each month, we can see that for Emails, Calls and Purchase line plots there is a bit spike in months that have 31 days, a slight drop in months that have 30 days and reasonable drop in February of 2016 and 2017.
For meetings on the other hand there is an upward trend. Need to be noted that some months of meetings were filtered out because they showed values around 0. Starting from October 2015 we might notice increase in the number of meetings.
To compare the months in each year I have plotted the cycle plot where we might observe some drops and ups over the 2.5 years.
Is the company growing?
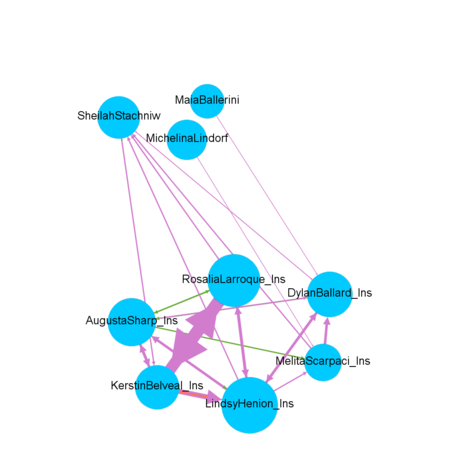
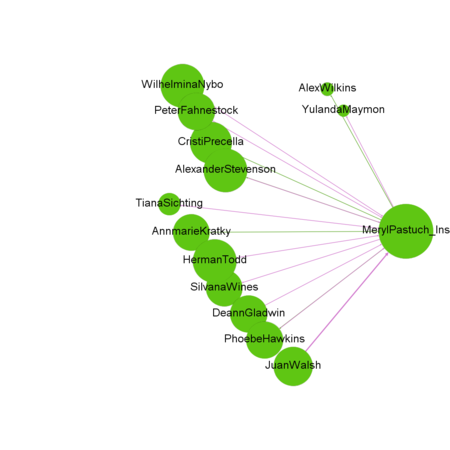
Who else appears to be closely associated with suspicious group?
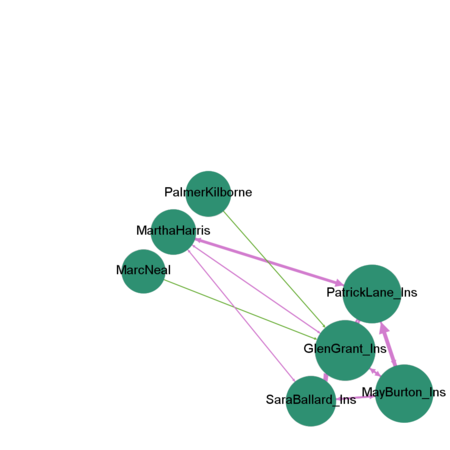
Community_1
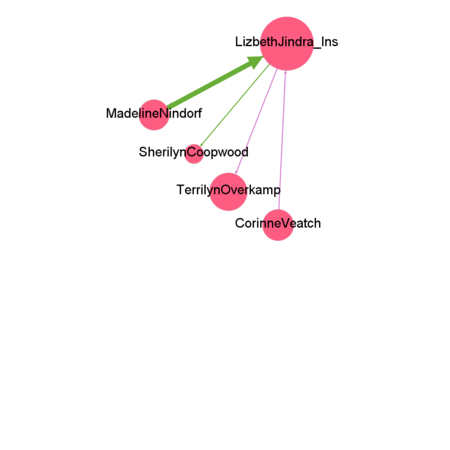
Community_2
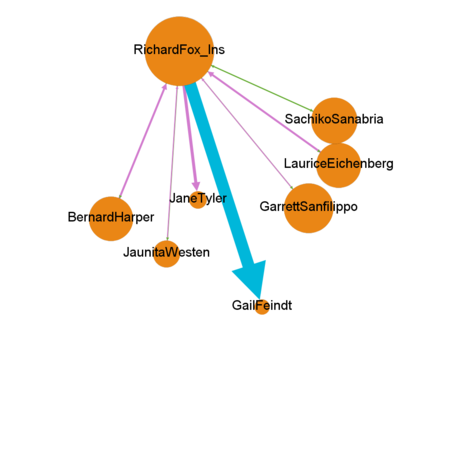
Community_3
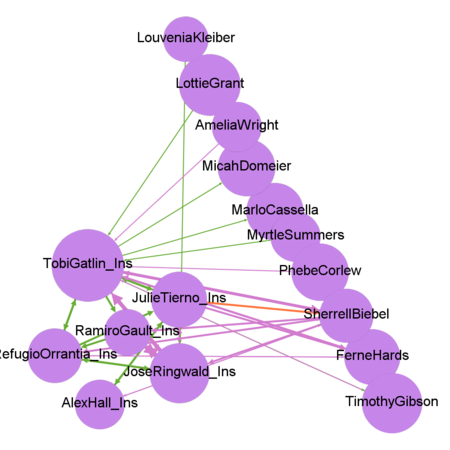
Community_4
Community_5
Community_6


Which employees are making suspicious purchases?
Organizational structure and a full picture of communications
Changes in the group composition depending on activities
Group interactions over time