ISSS608 2017-18 T3 Assign Jyoti Bukkapatil Observations & Insights
Revision as of 14:31, 8 July 2018 by Jbukkapatil.2017 (talk | contribs) (→Analysis through visualisation)
|
Question 01
Question 02
Question 03
Question 04
|
Question 01
Using the four large Kasios International data sets, combine the different sources to create a single picture of the company. Characterize changes in the company over time. According to the company’s communications and purchase habits, is the company growing? Limit your responses to 5 images and 500 words.
Analysis through visualisation
Please note that data for Q3 Year 2015 was excluded to for better visualization of the trend.
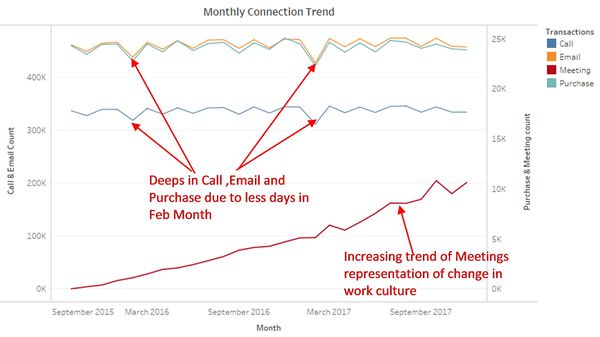
- Time Series plot in figure 1 shows the monthly pattern for Calls, Emails, Purchases, and Meetings. The overall trend for Calls, Emails, and Purchases is stable throughout the past two years. This indicates that Kasios International is the stable company. There is neither a significant growth or decay.
- From figure 1 Call, Emails and Purchases are highly correlated and follow the same trend. Monthly Ups and down in calls, emails, and purchases follow the number of days in months. Deeps can be observed for months with 30 days and ups can be observed for months with 31 days. Similarly, two major deeps are for Feb 2016 and Feb 2017 respectively.
- The continuous increasing trend of Meetings might be due to a change in work culture or some new initiatives.
Figure 1
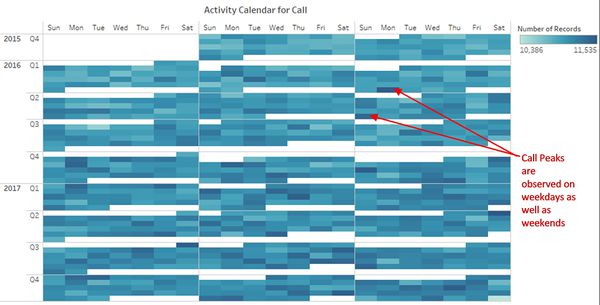
- Calendar view of daily calls (figure 2) shows that calls are randomly distributed throughout the week. There is no fixed pattern for the number of calls. There are peaks on weekdays as well as weekends. This might be because this is an international company and employees were working with people around the world from different time zones.
Figure 2

