From Visual Analytics and Applications
Jump to navigation
Jump to search
Question 1 : Chemical Trends
| Observations and Insights |
Visualization |
| Sampling pattern :
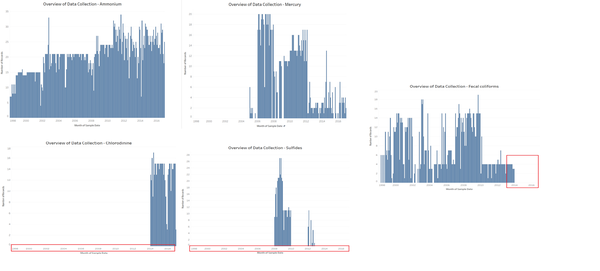
The Waterway sample readings taken by the hydrology department shows an different pattern in the data collection in the past and recent years among the chemicals. The number of records every month taken by the sensors and monitors are different for each chemical. As shown below there are broadly five categories of data collection by the hydrology department:
1. Complete Data: These chemicals have data from the year 1998 – 2016 taken by the hydrology department. Even though the number of readings are different across the years, they have the complete pattern to detect the trends and anomalies. These are chemicals like Ammonium, Magnesium, Sodium, Sulphates, Zinc , water temperature.
2. Data Available for Last few years: These chemicals have data for the last few years from 2005-2016 taken by the hydrology department.These chemicals were not considered and recorded in the years before 2005. This pattern is exhibited for the chemicals like Mercury, Total nitrogen, total hardness.
3.Data Missing for Recent years: These chemicals have data missing for the recent years from 2014-2016.This might be due to the disappearance of chemical content in recent years or the sensors and monitors dint capture the data. This pattern is exhibited for the chemicals like Fecal coliforms, Atrazine, Endrin.
4.Data Available only for Recent years: These chemicals have data missing for the past years from 1998-2013.This suggests an possible interest in the investigation as the main toxic chemical namely Methylsomine falls in this category. Is there any reason behind not collecting the data for the past years? This pattern is exhibited for the chemicals like Chloridine, Methylsomine, Total organic carbon.
5.Sparse Data: These chemicals have data missing in between from the years 1998 - 2016.This causes the data to be sparse and also making it difficult to see the chemical contamination for these chemicals.This pattern is exhibited for the chemicals like Sulfides, Carbonates, Aluminium.
|
|
