From Visual Analytics and Applications
Jump to navigation
Jump to search
VAST Challenge 2018:Mini-Challenge 2: Like a Duck to Water
Tools
Data preparation
- From the chemical units of measure file, we see some chemical units have unrecognizable value, after we check it should be replace in µg/l.

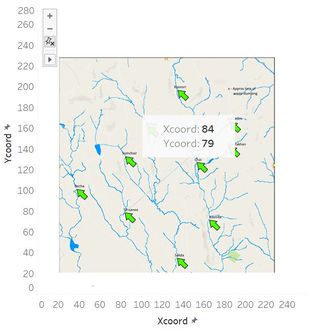
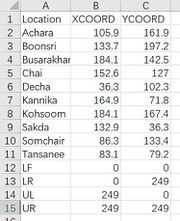
- In order to show geographical visualization, we can use the X-coordinate and Y-coordinate get from the given waterway picture, use the annotate point function from Tableau to get the data of these 10 locations.


|
| Value
|
Measured value for the chemical or property in this record
|
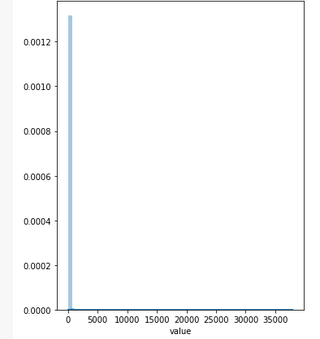
We see that values are represented on different scales according to the 'Unit' so it Range from 0 to 37959.28 with a mean of 24.02. it is not easy to do normalization or transformation, but it would be a problem when doing analysis.

|
| Location
|
Name of the location sample was taken from.
|
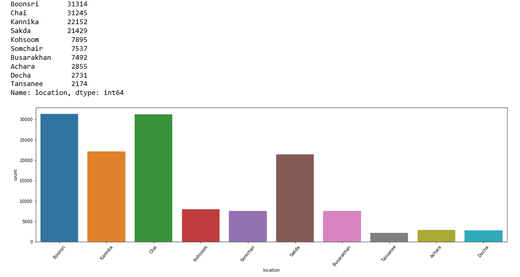
10 different locations - Achara, Boonsri, Busarakhan, Chai, Decha, Kannika, Kohsoom, Sakda, Somchair, Tansanee. from the picture below, we can see the total number of readings collected at each location, it indicates a lack of consistency in collection of the chemical samples of different locations.

|


