From Visual Analytics and Applications
Jump to navigation
Jump to search
 VAST Challenge 2018:Like a duck to water
Methodology & Design
Methodology
| Description |
Illustration |
| 1.Selecting the right chemicals
Pollution in the waters of the reserve is defined by many measures but the data set only provides enough data for a set of measures
|
|
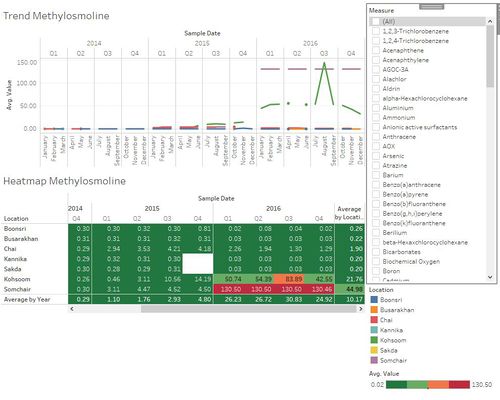
| 2.Visualizing the overall trend and specific changes
The chemical measures were visualized per quarter and year vs Location. This helps understand the trend for each selected chemical
|
|
| 3.Understand the specific changes
The data provided is all about the chemicals taking the readings and the date and time when the readings were taken (timestamps). This provides valuable information on the paths adopted by different vehicles inside the preserve – where did they go and what time did they go. Thus, one of the core patterns of life analysis will be centered around the paths adopted by different types of visitors identified in 1.
|
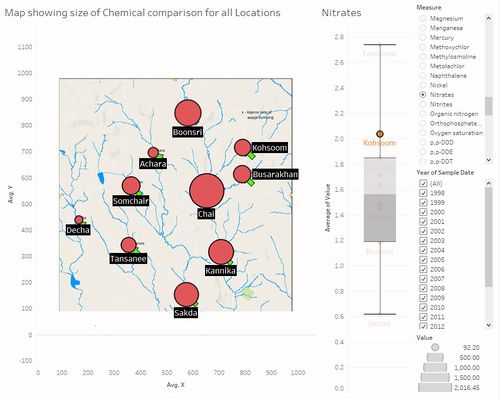
| 4. Visual interpretation and distribution analysis
For better user experience I have elaborated a dashboard with a visual representation of each chemical in each location with its specific distribution in a box plot.
|
|
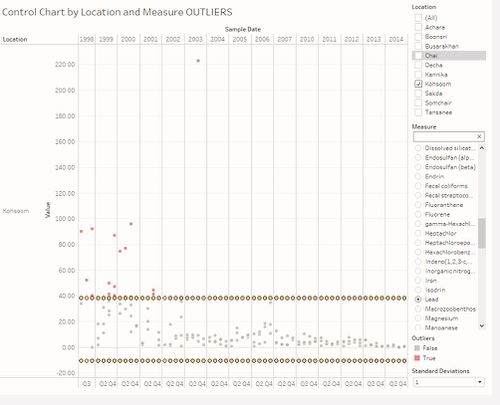
| 5.Outliers analysis
With a control chart the user can determine easily specific outliers for each chemical selecting 1, 2 or 3 standard deviations from the average.
|
|
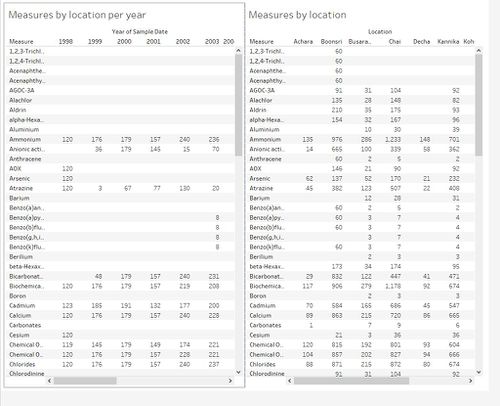
| 6.Analysis of anomalies and sampling recommendations
To understand the sampling strategy in the dataset and suggest improvements I have created a dashboard
|
|

