ISSS608 2017-18 T3 Assign Yi Xiaoqin Conclusion
Jump to navigation
Jump to search
 VAST Challenge 2018 MC2: Like a Duck to Water
|
|
|
|
|
|
VAST Challenge 2018 MC2 Answer
Question 1
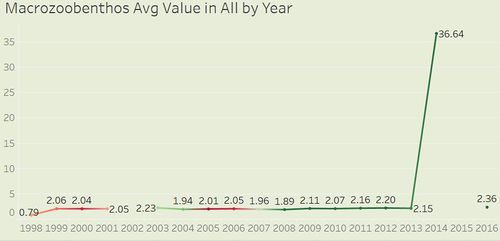
- From 1998 to 2013, the average macrozoobenthos value was stable around 2 unit, however, from 2013 to 2014, it increased sharply and in 2016 it returned to the normal level regardless one year missing data. If the macrozoobnthos value exactly refers to MCI, the higher positive MCI is, the better the environment is.

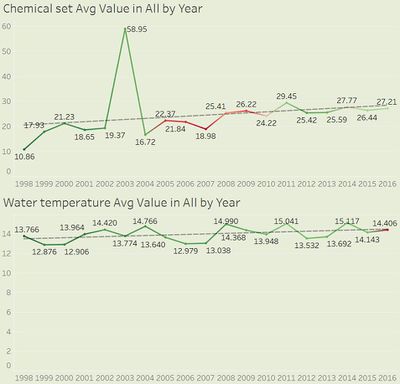
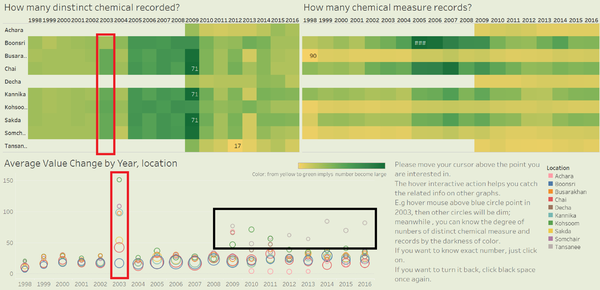
- Generally, water temperature went up and down as time went but kept around one trend line to increase very slowly; the chemical value increased from 10 to 27 and the increasing trend has been going on. Noted there is an outlier point in 2003 when the chemical average value became much higher than usual.

- Among the 10 sampling sites in the preserve area, some locations have very similar trend and shape as the overall does. For 3 so-called “new comer” locations of which they had records since 2009, Achara, Decha and Tansanee, they only include 1 or 2 Macrozoobenthos records in 2012 or 2016. Interestingly, when looking at the chemical set value-changing pattern, Achara and Decha were quite different from Tansanee. The former locations had high values at first but declined to be close to the overall average value in 2016 (in the end). On the contrary, Tansanee had gone through decreasing time but at last, it increased even more than the beginning value.
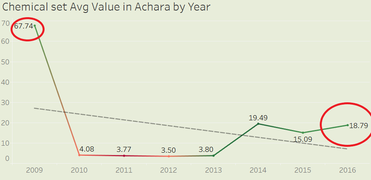
Achara
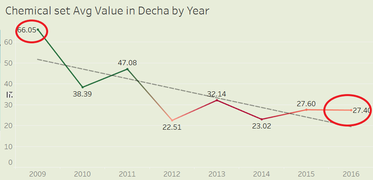
Decha
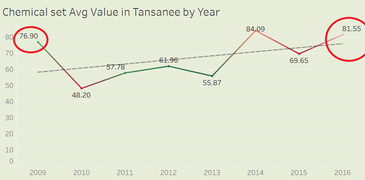
Tansanee


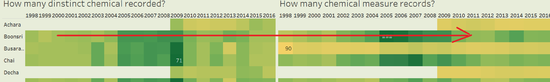
- Over the 19 years, number of distinct chemicals and total chemical records increased first, and then reached a peak value in the mid of the date range and decreased later.

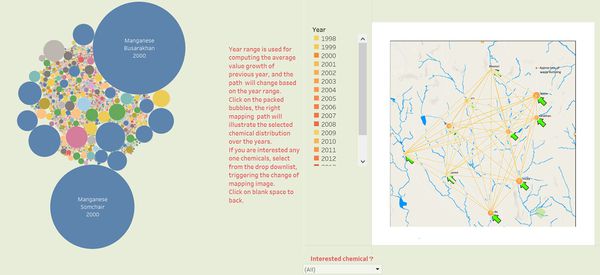
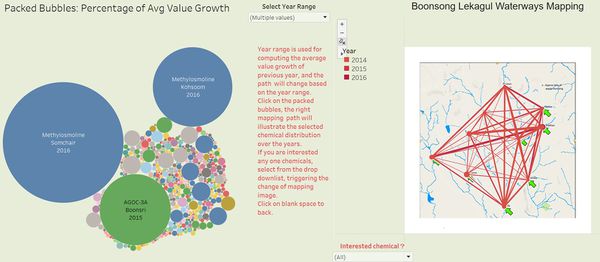
- When it comes to yearly growth comparison, for all the years, chemical Mangenese existed at the most locations and had highest growth. This chemical almost had records in every location in the preserve.If we look at the most recent three years, the dominant chemicals change to Methylosmoline, followed by AGOC-3A. Correspondingly, the chemical path become thicker, which means in these years, the detected and recorded chemical contaminants has grown higher and nearly all sampling sites in preserve area have some of the chemicals.


Question 2
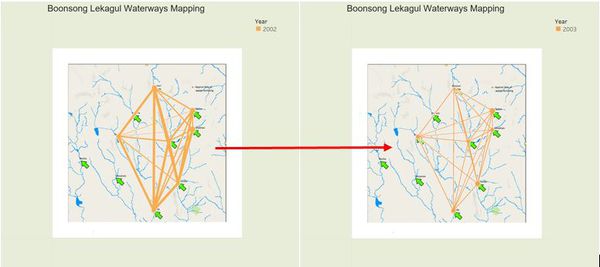
- From the visualization angle, there is an anomaly in 2003; almost all the locations had much higher chemical average values than previous records, then we dive into 2002 and 2003 waterway situation via mapping graph. it is more intuitive and clear that chemicals still distribute among those locations, but the number of records was reduced, leading to the high average value; Boonsri had lower chemical value while other locations all experienced a super high average values.


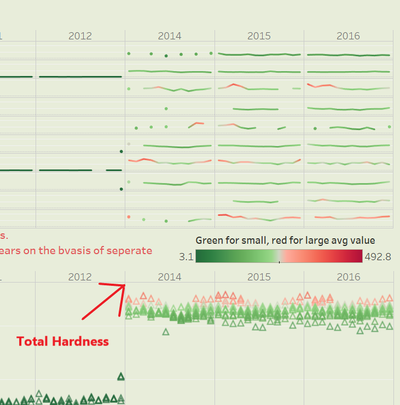
- As we know from Q1, macrozoobenthos had a sudden increase and then decreased to a low point. This measure swiftly changing in such a short time may relate to an environmental damage. This anomaly from 2014 to 2016 might be caused by some chemical contaminants’ change under suspecting. Based on packed bubble plot result, we look into three prominent chemicals in the path pattern. Even if the highest values of Methylosmoline and AGOC-3A were in different sites, they have distributed in similar pattern, from upstream to downstream across two river branches. As for total hardness measure, every possible location of waste dumping have records, and the red lines imply more observations concentrate on these places. They seemed to move from several upstream sites to the confluence at Sakda in recent years.


- Following above logic, we can make speculations and possible conclusions simply based on the give hydrology data and relevant visualization. In a nutshell, the waterway samples have detected toxic manufacturing chemicals like Methylosmolene that was increased significantly; in addition, a variety of chemicals have existed in the 10 suspicious locations since 2009, with some declined but more new chemicals detected. Supposedly, the waterway situation is not good even worse due to the chemical contamination expansion.
- The anomalies help to find the feasible direction of environmental problem analysis but no sufficient data supported to reach very reasonable conclusions in the industry. To better analyze the chemical contamination and the soil damage evidence, below are data that would be helpful in this case:
- Provide more detailed sub-category of chemical contaminants would be better to understand what class (es) exact, result in the soil deterioration, like microorganism, disinfectants or organic chemicals in regulated water contaminants.
- Since the current data field ‘Value’ is absolute number, user cannot make sure whether the total one, mean value, combination with another chemicals or something can signify its severity of chemical contamination. Here to propose to offer a feasible explanation or range for different chemicals.
- For the new ranger station, no data related has been provided; we cannot ensure the real waste dumping site and station location. Also if there is data about water permeation and soil constitutes, more professional info can be justified.
Question 3
- Apart from the overall chemical situation discussed before, certain noticeable points may result in concerns for wildlife in the preserve. For example, as the part of graph shows, total hardness started to increase from 2014 and kept high value all the way. Usually the hardness of water refers to dissolved minerals like manganese. It is not a definite health-care problem, but it could cause trouble to wildlife like Pipit and brown trout. If the hardness or other chemical contaminants continue to increase in the water and dissolve in the main river in future, the wildlife’s habitats may be affected even damaged. Thus, further investigation should be conducted.

- To clearly explain the preserve situation and solve problems for wildlife, I suggest several sampling collection strategy as below:
- Provide data fields related to wildlife living conditions, migration statistics or mortality rate, at least the official relevant document, so that we can derive useful indicators or other variables, which helps to elaborate the relationship between wildlife including Pipit bird and chemical contaminants.
- To precisely determine how the preserve situation changes and how the changes affect wildlife’s existence, the sampling approach could collect the date point of wildlife changing events, accurate to quarter, month even more detailed if necessary to mine other information.
- The waterways map is not accurate enough for user to explore; I would suggest offering geographic data, like plants area nearby, of Boonsong Lekagul Wildlife Preserve to construct cloud images and other real-world graphs. With these images, user would know the true situation and better justify visual analysis results.
- Not only collect water temperature and chemicals, also take some human activity data before and after building the new ranger station as well as the exact location and time of this station.
Comment
Hi, your comment is welcomed and appreciated :)
