ISSS608 2017-18 T3 Assignment SHI CHEN Data Exploratory
|
|
|
|
|
Dataset Description
Here is the brief description of data given by Vast Challenge. In total, there are two files, one is "Boonsong Lekagul waterways readings", which is showing the record of each chemicals throughout the timeline and observation location.
| Variable | Description |
|---|---|
| Id | ID of each record |
| Value | Measured value for the chemical or property in this record |
| Location | Name of the location sample was taken from. They are Achara, Boonsri, Busarakhan, Chai, Decha, Kannika, Kohsoom, Sakda, Somchair, Tansanee. |
| Sample Date | Sampling time (The record shows it was from Jan 1998 to Dec 2016) |
| Measure | Measurement indicators, including more than 100 chemicals and water temperature monitoring as well as monitoring of a biological quantity |
| Unit | Unit of measured chemicals. There are mg/l, µg/l and C. (Macrozoobenthos is not listed with any type of units. ) |
Methodology
Workflow
I. Data preparation:
Combine three tables together to get full picture of changes in all observation years, observation location and chemicals.

II. Geographical preparation:
There is a topographic map in this area. But there’s no other information like latitude and longitude. It should only be used to generate relative coordinates for each observation location.
III. Data exploration:
The geography, the number of species, the number and type of measurement, the number of detections, and the timeline are combined together to explore, to discover their associations and identify the potential factors affecting birds.
IV. Statistical application:
To find out the abnormal chemical elements faster, in addition to looking at the change values of each substance in turn, I also introduced the concept of Z-score to assist the judgment.

The larger the value of z score, the greater the volatility that represents it.
V. Final deliverable: This challenge analysis was done in tableau. Link:
Tool
- Tableau : Used to do EDA and build dashboard
- JMP : To look through distribution of data
Data exploratory
Hydrological overview
*How many observation location and streams are there in this area?
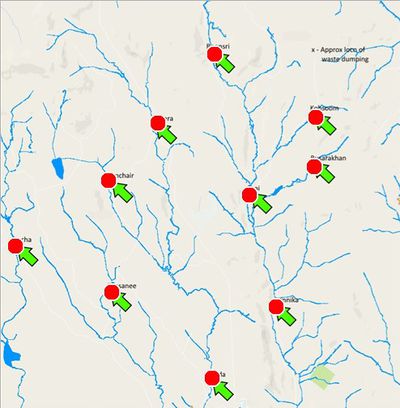
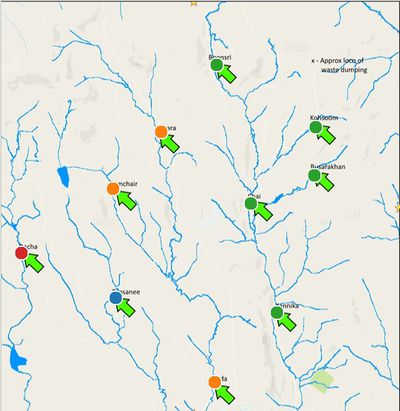
In total, Hydrology department has gradually set 10 stations from 1998-2016. More specifically, Achara, Decha, Tansanee were added as observation station since 2009.
According to the map river distribution, the 10 stations are distributed in the upper, middle and downstream of 4 different streams. In order to facilitate the analysis of the correlation of different points in a river, these observation points were grouped. From right to left are path 1, 2, 3 and 4. In the below graph, the locations with same color are in the same stream.
*What is the flow of the river?
As all the streams are originated from the north part, it can be speculated that the terrain in the north is higher than other area. The river flows southward as a whole.
*What is the monitoring time and frequency of the Hydrological Department?
Monitoring Time:
Current data indicates that the monitoring period for the hydrological sector began in 1998 and three new locations were added in 2008.
Conjecture1: This may indicate that at earlier years, these three years appeared environment problems.
Reference
| Hydrological measurements - published by Important India | https://ocw.tudelft.nl/courses/hydrological-measurements/ |
| TBC - published by Data2X | TBC |


