ISSS608 2017-18 T3 Assign Jyoti Bukkapatil Data Preparation
Data for Visualisation
Data provided by Kasios International insider has been 10 different CSV files. These are mainly different call records, email records, Meeting records and Purchase records from 11th May 2015 14:00:00 hours onwards. All files contain Source, destination, connection details and time in seconds. Below table shows details of different files providing The Kasios Insider.
| Index | Data | File Name | Number of Records |
|---|---|---|---|
| 1 | Call records for the whole company company starting from 11 May 2015 14:00:00 hrs | calls.csv | 10606835 |
| 2 | Email records for the whole company starting from 11 May 2015 14:00:00 hrs | email.csv | 14550085 |
| 3 | Meetings records for whole company starting from 11 May 2015 14:00:00 hrs | meeting.csv | 127351 |
| 4 | Purchases records for whole company starting from 11 May 2015 14:00:00 hrs | purchaces.csv | 762200 |
| 5 | Company employee ID and Name list | CompanyIndex.csv | 642631 |
| 6 | Suspicious call records of suspecious group in company ,starting from 11 May 2015 14:00:00 hrs | Suspicious_calls.csv | 70 |
| 7 | Suspicious email records of suspecious group in company ,starting from 11 May 2015 14:00:00 hrs | Suspicious_emails.csv | 61 |
| 8 | Suspicious meeting records of suspecious group in company ,starting from 11 May 2015 14:00:00 hrs | Suspicious_purchases.csv | 5 |
| 9 | Suspicious purchases records of suspecious group in company ,starting from 11 May 2015 14:00:00 hrs | Suspicious_meetings.csv | 1 |
| 10 | Suspecious 7 purchases records | Other_suspicious_purchases.csv | 7 |
All data files contain only four columns:
- Source ID: Company ID of the person who has initiated connection i.e. either Called someone, sent email, invited someone for meeting or purchases something
- Etype: Connection details i.e. 0 – Calls, 1 – Emails, 2 – Purchases and 3- Meetings
- Target ID: Company ID of destination person for connection
- Time Stamp: Time in Seconds starting from 11th May 2015 at 14:00
Data Preparation
Column names were changed to make it easy to understand and analyze.
- "Source ID" was changed to "Source".
- "Target ID" was changed to "Target".
- "Etype" was changed to "Communication Mode".
- "Time Stamp" was changed to "Time in Sec".
Time Stamp Calculation:
JMP Pro 13 is used for data exploration and preparation. Converted Time in Sec to Date and Time By below formula in JMP.
MDYHMS (: Time in Sec + Date DMY (11, 5, 2015) + In Hours (14))
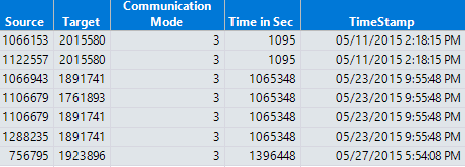
Date time format was changed to "m/d/y h:m:s". After changing column names and calculating the date-time value, the final data table is as below.
Data Distribution over time:
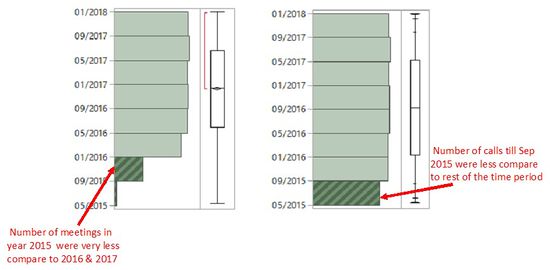
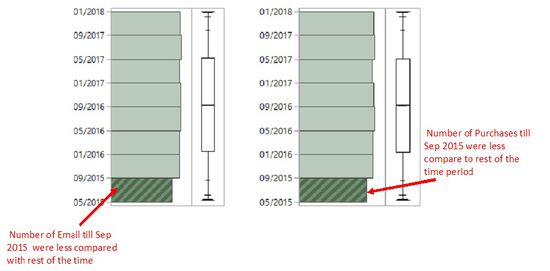
- It was observed from the data distribution that a number of meetings in 2015 were very less compared with the rest of the two years. There was no way that we would be able to find whether data is missing, or it was the fact that fewer meetings took place during 2015. For better visualization of meetings pattern, this data was excluded. Similarly, for Calls, Emails, and Purchases, Number of records from May 2015 till Sep 2015 were less compared with the number of records for the rest of the time. So these were also excluded for further data visualization.
Data Preparation for Suspicious Records:
Below four datafiles were combined to create a single file for all suspicious activities and names as "Suspicious_all.csv"
- Suspecious_calls.csv
- Suspecious_emails.csv
- Suspecious_meeting.csv
- Suspecious_purcahses.csv
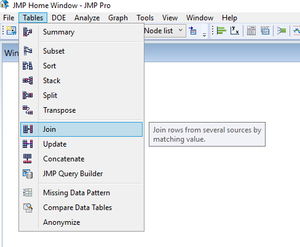
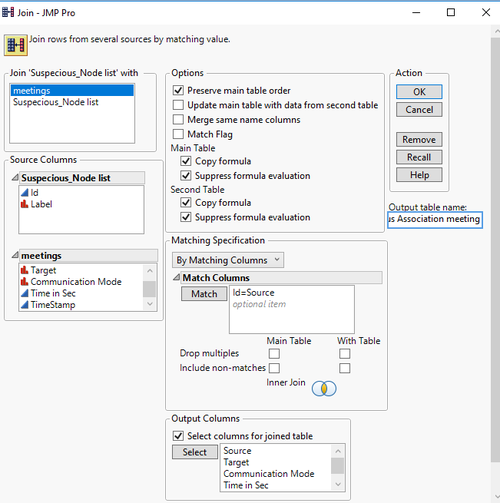
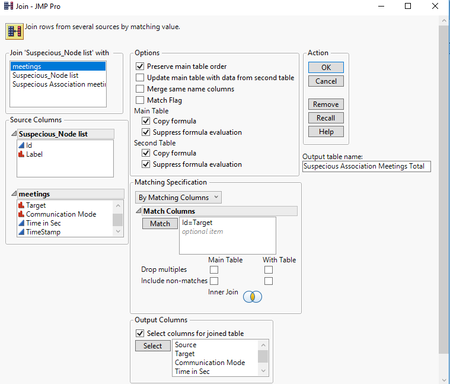
Timestamp was calculated with the same formula as described in Time Stamp calculation section. List of the 20 suspicious employees was used to extract interactions of these 20 employees with rest of the employees from the company. This was done by using join function JMP pro. Figure 3,4 & 5 shows the steps involved in this data preparation.
[
