ISSS608 2017-18 T3 Assignment LIU YUQING Data Preparation
|
|
|
|
|
Contents
- 1 Dataset description
- 2 Map view
- 3 Data augmentation and data pruning
- 4 Data cleaning
- 4.1 Step by Step Discription
- 4.1.1 Exclude misleading records
- 4.1.2 Extract the car sequences
- 4.1.3 Label vehicles in their movement order and then create Episode based on the movement order and id
- 4.1.4 Compute the last duration, camping hour and single checkpoint duration
- 4.1.5 Coordinates Extractation and Preparation for Gephi
- 4.1.6 Participent Segamentation
- 4.1 Step by Step Discription
Dataset description
Mini-Challenge 2 provides two datasets - [Boonsong Lekagul waterways readings.csv] and [chemical units of measure.csv] and one map image about rivers and streams of some specific locations. [Boonsong Lekagul waterways readings.csv] includes 5 variables: ID, measure, value of masure, location and measuring date. There are 10 locations, 106 measures and measuring date span is from 1998 to 2016. [chemical units of measure.csv] includes measures and unit of each measure.
Map view
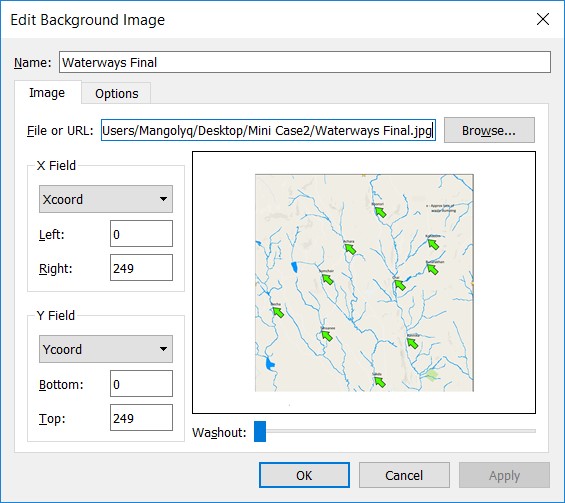
According to the map image, we can observe geographical distribution of locations, in order to get specific coordinates of each location, we add the image into tableau as background and set basic range of coordinates of X axis and Y axis given by Mini-Challenge 2.
Here we added point as annotate on the top of each arrow of each location, so X&Y coordinates of each location will show on the map. We do same for all other locations and we get the [Location.xlsx] file about coordinates of each location.
Data augmentation and data pruning
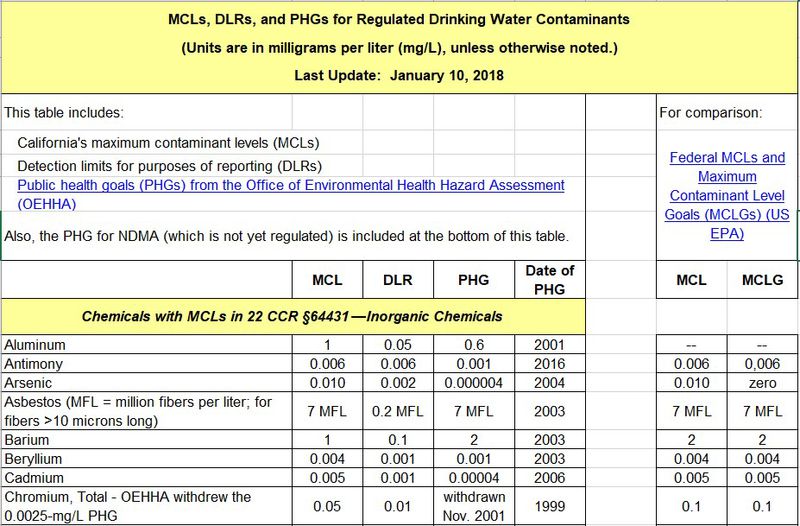
After overview of whole data, we observed value variance among measures are quite big, and measuring time span of each measure also varies greatly. Units of measures are mainly separated into ug/l and mg/l, it’s hard for us to estimate whether the value of this chemical is toxic for water or not. In this case, I found a file from the California Water Board as reference.
This file provides MCL(California’s maximum contaminant levels) and DLR( Detection limits for purpose of reporting) of about 120 measures for regulated drinking water. Maximum level of contaminants in drinking water should be lower than raw water, so any value of chemical less than its corresponding level could be considered insignificant.
Notice: all units are mg/l in this file.
Data cleaning
Steps:
1. Compare measures of Boonsong Lekagul waterways readings with measures given in California Water Board. Check measures one by one of both dataset, selected common measures of both. There are 25 measures appeared in CWB in total. Saved the 25 measures in [Measures with MCL] file
2. Unify units of MCL value to standard unit of these 25 measures, for measures with unit ug/l, changed the maximum value in CWB as ug/l for comparison.
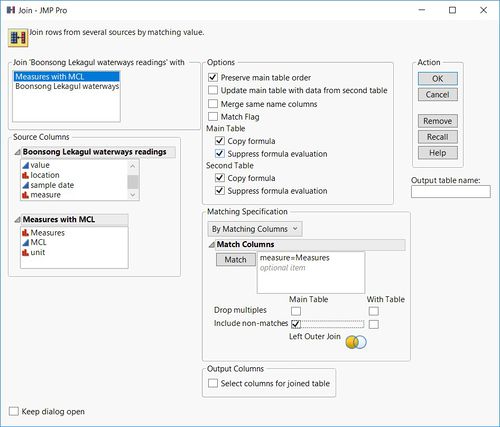
3. Join [Measures with MCL] table to [Boonsong Lekagul waterways readings] table in JMP using left outer join so that measures not contained in CWS can also be reserved. We saved the joined data as excel file.
Join table with MCL level
Compare value of these measures in excel, for those lower than MCL level, delete the datapoints, others all stay same. Using if function: =IF(B:B<G:G,"null",B:B), column B is measured value, column G is MCL level, after calculation, data file looks like below:
Step by Step Discription
We deleted all records with “null” value. After data cleaning, 13 measures all cleaned, which means their value are all lower than MCL level over the date, they are:
1,2,4-Trichlorobenzene 2008 – 2009, Aldrin, Alachlor, Aluminium, Barium, Berilium, Endrin, Hexachlorobenzene, Mercury, Methoxychlor, Pentachlorobenzene, Selenium,Simazine.
Now data records are 110,581 and we save the remain data as [Measures exclude nonimpact] file.
Exclude misleading records
|
Exclusion criterion: (1) id without full movement records( all visitors should come in and get out from both entrances so those ids that only have one entrance should be excluded). (2)id without full timestamp records.( those id without the come in and get out records). (3) repeat records |
Extract the car sequences
| The most essentail step for data preparation is to extract the car sequences which helps to summary the life patterns. This step is conducted in JMP with the function[Col Rank(Timestamp,car-id)] |
Label vehicles in their movement order and then create Episode based on the movement order and id
| Number the movement order for each car-id and then list the car-id with episode.
Level: The order of movement(entrance---gate :level of entrance is one and the level of gate is two) Episode: Each entrance & exit is one episode, so normally each id should has only one episode. |
Compute the last duration, camping hour and single checkpoint duration
| Compute the multipul duration in excel for better visualization.Last duration(day),camping hour(hour),single checkpoint duration(min) |
Coordinates Extractation and Preparation for Gephi
| Extract the coordinates in tableau and then prepare the coordinates for Gephi visualization |
Participent Segamentation
| All the participents are classified into Camper,No-camper and Ranger |


