ISSS608 2017-18 T3 Assign Low Zhi Wei Visualisations
Through the use of a few specific types of visualisations, and a deep-dive into each individual chemical, a few findings and insights were uncovered around the climate of the reserve, potential gaps and opportunities of improvement for sampling, fluctuations in Methylosmoline, and some other chemicals of interest. These findings are presented below.
Contents
Findings 1 - Climate
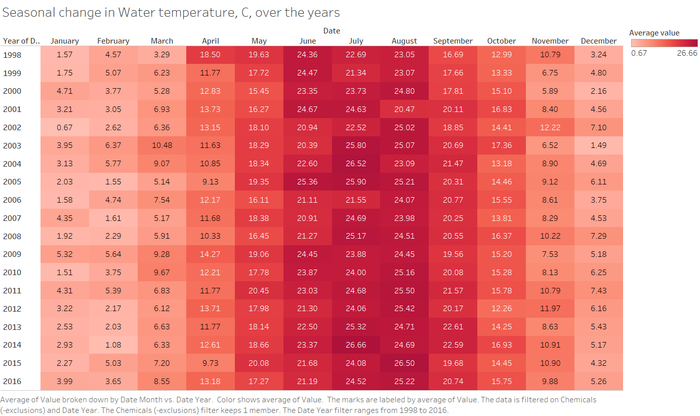
The water temperature varies seasonally over each year. This makes sense intuitively as the temperature of water would rise and fall in accordance to climate changes. From the chart below, warmer parts of the year are from June to August, while the cold months are from December to February.
Impact on other chemicals
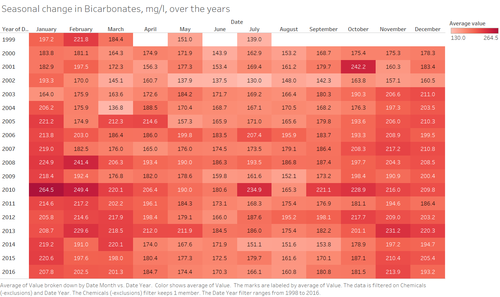
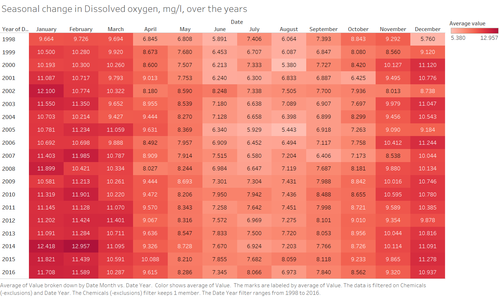
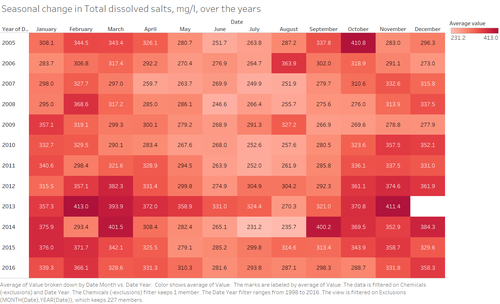
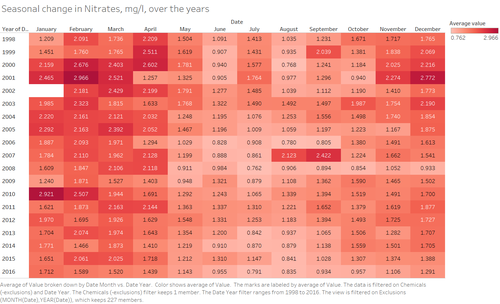
With the variations in climate, there also appears to be a similar but inverse pattern of variation on a few chemicals, which hints that temperature of the environment may have a subtle effect on the naturally occurring quantities of these chemicals in the soil.
Note: Uppermost extreme values for Total dissolved salts and Nitrates were excluded to enable greater visual differentiation of intra-year variations.
Findings 2 - Data outliers and potential sampling issues
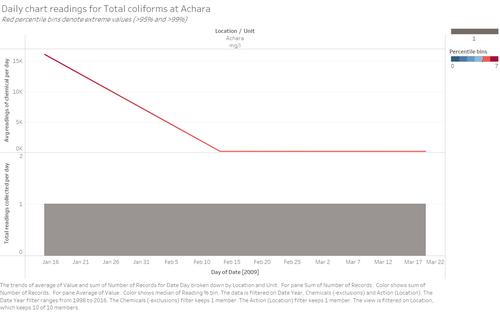
While this exercise seeks to find patterns of interest, which includes extremities in fluctuations, it is important to also be mindful of the fact that such outliers may be potential errors arising from inherent data deficiencies.
The following charts present a few outliers which are suspect.
Total Coliforms
subhead 2
placeholder
Findings 3
placeholder
