From Visual Analytics and Applications
Jump to navigation
Jump to search
 ISSS608 Assignment Huang Yiyun - MC2
|
Tool
|
Approach
|
Findings
|
|
JMP
|
Data Exploration
|
- There is no missing data in "Boonsong Lekagul waterways readings.csv" dataset, but there is only one missing value in "chemical units of measure.csv" dataset, I just deleted it.
- There are some sample dates need to recode.I recoded 2098 to 1998 and 2099 t0 1999.
In "chemical units of measure.csv", units are different,such as mg/l and μg/l.
|
|
2.
|
Microsoft Excel
(Data Wrangling)
|
- Use filter and pivot table function in Microsoft Excel extract out the data we need and rename them as revised value(μg/l).
- Given thr geographical analysis we also record the geo-code of background image in the data file.
|
|
3.
|
Tableau
(Data Analysis)
|
- Import raw data into Tableau and inner join the geo-code.

- From the view of trend change, we can oberserve there are two dramaticlly increase in both 2003 and 2009.
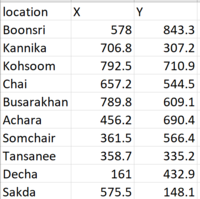
- In addition, 2 locations were taken into consideration of sampling extraction site since 2009. Especillay in Tansanee, it always occupies the largest value of chemical contamination in recent years.
- To prove whether the Kasios Furniture Company caused environmental damage to the Boonsong Lekagul Wildlife Preserve, we select the sample from recent 3 years and combined them with the maps.
- To be specific, we would like to view the measure performances in different locations in a treemap.
|
 ISSS608 Assignment Huang Yiyun - MC2


