Group27 Proposal
Group 27: Airbnb's Impact on Affordable Housing in New York
| Overview | Proposal | Poster | Application | Report |
ABSTRACT
Community groups and housing advocates in cities across the world have begun to sound the alarm about the impact Airbnb is having on affordable housing in their communities, citing concerns about housing supply lost. Quality of life is also a concern for residents who have seen their neighbourhoods use house for short-term rentals. We chose New York, a typical Airbnb city, as an entry point to understand Airbnb’s crisis in cities . We aim at presents a comprehensive visual analysis of 3 years from 2015 to 2017 of Airbnb activity in New York City. It relies on the most comprehensive third-party dataset of Airbnb activity available, and methodologies of visualize and analysis geographic data. Accordingly, we want to explore the Airbnb activity in New York City, discovering different neighborhood’s distinct characteristics by Geospatial pattern analysis across 3 years. Meanwhile, we go further to to investigate the profiter from the New York Airbnb revenue, to see whether the New York’s short-term rental laws affected these profiers
|
|
OBJECTIVES
Airbnb Geospatial Pattern Analysis:
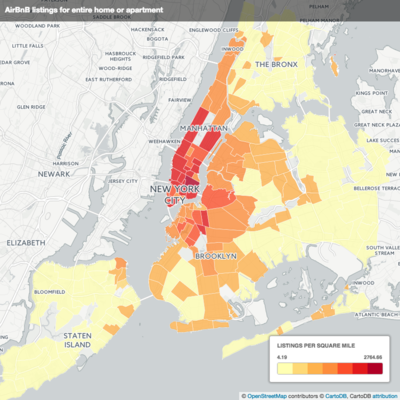
- Using geospatial analysis tools to map out the Airbnb property distribution in New York City across 5 boroughs from Year 2015 to 2017. We intend to visualize the sprawling pattern in New York City and dynamically changing density of listing Airbnb property in each neighbourhood.
- To refine the given broad geographic pattern, we turn to investigate the revenue-earning patterns in multiple neighbourhood derived from listing price and transaction records. The Airbnb revenue patterns would be compared with the gross rent income records across neighbourhood, which unveils the geographical rental gaps under two different “renting”form – Normal and Airbnb-ed.
Airbnb Revenue Profiter Analysis:
After exploring the Airbnb activity in New York City, we tend to explore Who Makes Money From Airbnb?
With the developing of Airbnb in New York, an increasing number of hosts have incentive to operate their property as Airbnb for listing short-term rental instead of lending out. In this context, two kinds of host emerged.
- Commercial Airbnb operators, who have multiple entire-home listings or large portfolios of private rooms, they operate Airbnb as business.
- Illegal hosts, who might not operate many listings and treat Airbnb as business, they are more willing to gain benefits based on their own property. Looking for quick return is their strategy.
Based on these situation, we will explore the relationship among hosts, Airbnb NYC and New York’s short-term rental laws
DATASET
| Data | Format | Description | Source |
|---|---|---|---|
| Listing | csv | Summary information and metrics for listings in New York City. | http://insideairbnb.com/get-the-data.html |
| neighbourhoods | csv | Neighbourhood list for geo filter. Sourced from city or open source GIS files. | http://insideairbnb.com/get-the-data.html |
| calendar | csv | Detailed Calendar Data for listings in New York City. | http://insideairbnb.com/get-the-data.html |
| Selected Housing Characteristics | csv | Detailed Data for NYC's Occupied or Vacant, Own or Rent, Home Value. | https://factfinder.census.gov/faces/tableservices/jsf/pages/productview.xhtml?src=CF |
| Financial Characteristics | csv | Detailed Data for NYC's Household Income and Monthly Housing Costs. | https://factfinder.census.gov/faces/tableservices/jsf/pages/productview.xhtml?src=CF |
| Occupancy Characteristics | csv | Detailed Data for NYC's Household Size, Age of Householder, Family Type. | https://factfinder.census.gov/faces/tableservices/jsf/pages/productview.xhtml?src=CF |
TOOLS and PACKAGE
tidyverse: Consists of a set of R packages which are efficiently applicable for data wrangling and data visualization. Keeps data manipulation in a consistency of tidy approaches.
dplyr: Aims to provide a function for each basic verb of data manipulation.
maptools: Set of tools for manipulating and reading geographic data, in particular 'ESRI Shapefiles'.
shinyBS: Adds additional Twitter Bootstrap components to Shiny.
ggplot2: Based on the system for declaratively creating graphics, map variables to aesthetics
ggmap: A collection of functions to visualize spatial data and models on top of static maps from various online sources (e.g Google Maps and Stamen Maps)
REFERENCES
1. https://carto.com/blog/airbnb-impact/
3. http://www.wired.co.uk/article/airbnb-growth-london-housing-data-insideairbnb
4. https://threadreaderapp.com/thread/958390658481512449.html
5. http://www.sharebetter.org/wp-content/uploads/2018/01/High-Cost-Short-Term-Rentals.pdf

