Group17 Proposal
GeBiz: Who supplies to the needs of Singapore?
A Visualization-driven mining of hidden associations between government agencies and suppliers.
|
|
|
|
|
|
|
Contents
Abstract
Government Procurement is the procurement of goods and services on behalf of a public authority. As per policy, the procurements need to be done through an issue of public Tenders to prevent corruption, wastage, and local protectionism. GeBiz is the Singapore government's one stop portal for the above purpose. The data of past procurements are made available for the public in the Data.gov.sg portal. It is difficult to identify bias in such data available that have multiple transactions. Since a transaction involves various levels of the government, the bias may not be obvious while looking at the issuing authority and the supplier alone.
We propose an approach which combines network analysis, association analysis, and visual analytics to make this process easier. Traditionally, Association analysis has been used to identify relations between products purchased together. It is also applicable to any data that follows the format of multiple entities and a common transaction that links them together. In our case, the entities involved are the issuing agency and the supplier. The current visualizations treat all entities involved to be of the same category, thus making the visualization less intuitive. We want to come up with a visualization that can overcome this limitation.
Key Objectives
1.Build an R Shiny dashboard to visualize Government Procurement Data.
2. Use association rule mining to identify the Suppliers who are associated strongly with an issuing authority or the respective Ministry. This provides a way for users to seek and investigate if there are biasness when agencies source from suppliers.
3. Improve the conventional way of visualizing associative rule results and make it more intuitive and insightful.
Methodology
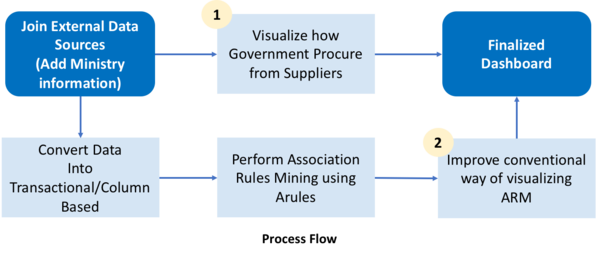
A simple process flow diagram below illustrates a two-pronged approach to help us achieve our objective of investigative and proactive monitoring of funds.
Understanding Associative Rules Mining
Association rules are if/then statements that help uncover relationships between seemingly unrelated data. An association rule has two parts, an antecedent (if) and a consequent (then). They are created by analyzing data for frequent if/then patterns. Metrics such as Support, Confidence and Lift are derived to identify the most important relationships. Take the following for example, if an Agency puts up a procurement contract, we will like to know if ABL Consultants will be the one likely to win the tender.
The three derived metrics depicted below are essential and will be used to select the interesting rules from all possible set of rules.
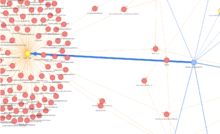
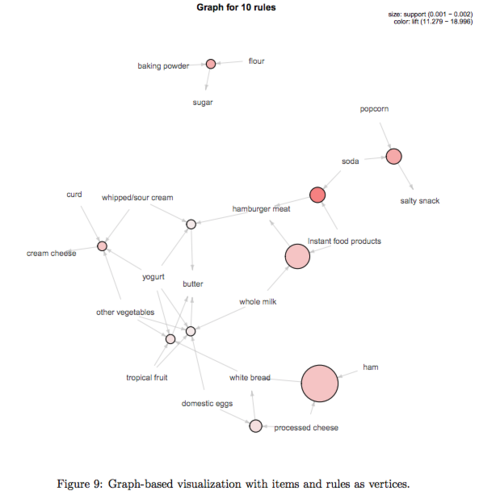
Once we have decided on the rules we are concerned with, a suggested graphical representation of these rules can be visualised using a network graph. With the size or colour set as lift, we will be able to detect strong associations between Agencies and Ministries with Suppliers.
Project Timeline
Data Sources
1. Government Procurement dataset available at:
https://data.gov.sg/dataset/government-procurement
2. Singapore Government Organizational Structure available in Wikipedia.
https://en.wikipedia.org/wiki/Organisation_of_the_Government_of_Singapore
References
1. Past Visual Analytics course project available at:
https://wiki.smu.edu.sg/1617t3isss608g1/ISSS608_2016-17_T3_Group8_Arules_Final_Projrct
2. Visual Analytics course slide available at:
https://slides.com/tskam/isss608-lesson10_ay2017-18t3/fullscreen#/5/13
3. Sankey Diagram in R
https://plot.ly/r/sankey-diagram/
4. Videla-Cavieres, I.F., & Ríos, S.A. (2014). Extending market basket analysis with graph mining techniques: A real case. Expert Syst. Appl., 41, 1928-1936.
5. Kyeong Kim, Hyea & Kim, Jae Kyeong & Yi Chen, Qiu. (2012). A product network analysis for extending the market basket analysis. Expert Systems with Applications. 39. 7403–7410. 10.1016/j.eswa.2012.01.066.
6. Association Rules (in data mining)
https://searchbusinessanalytics.techtarget.com/definition/association-rules-in-data-mining
7. Government Procurement
https://en.wikipedia.org/wiki/Government_procurement


