From Visual Analytics and Applications
Jump to navigation
Jump to search
 VAST Challenge 2018 MC2: Suspense at the Wildlife Preserve
Insights from Viz
Chemical Contamination: Trends of possible interest
| Insights |
Visualization |
| 1. Toxic manufacturing chemical - Methylosmolene
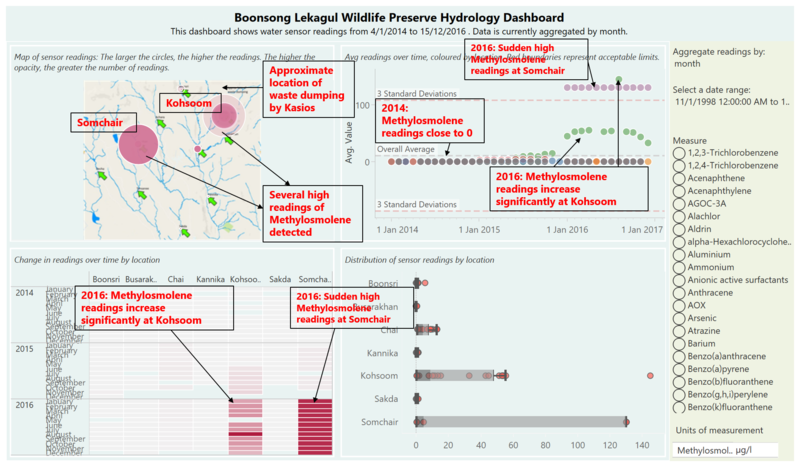
Sensor readings of Methylosmolene started from 2014, and only at the stations of Boonsri, Busarakhan, Chai, Kannika, Kohsoom, Sakda and Somchair. From 2014 to 2015, sensor readings of this toxic chemical was close to zero. However, in 2016, Methylosmolene readings at Somchair suddenly spiked to a very high, constant value of statistical significance (greater than 3 standard deviations from the mean. Readings also increased sharply at Kohsoom, which is the closest station to the approximate location of alleged waste dumping by Kasios.
Further investigation of these high Methylosmolene readings reveals that at Somchair, the high readings were constant at 130.5 ug/l throughout the year of 2016 without any change. It is possible that there could have been a problem with the sensor.
At Kohsoom, readings started increasing since the mid of 2015. There is one particularly high reading of Methylosmolene on 26 August 2016, which surpasses even the readings detected at Somchair.
|
|
| 2. Anionic Active Surfactant
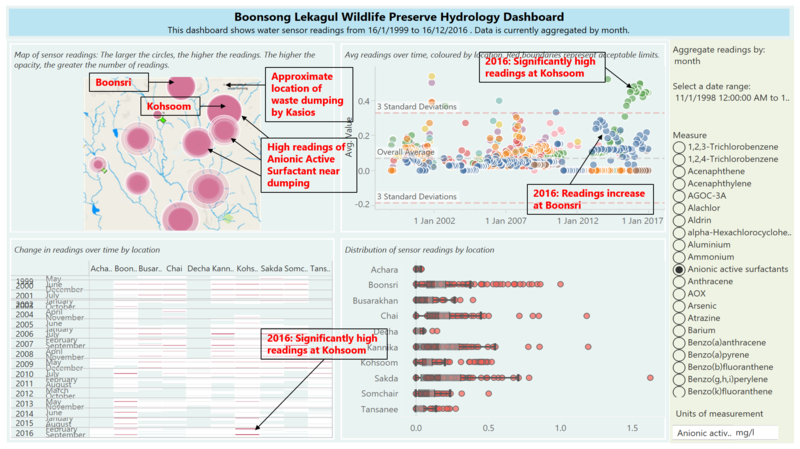
The station closest to the suspected waste dumping, Kohsoom, also detects significantly high readings of Anionic Active Surfactant in 2016. Readings also increased at Boonsri, which is relatively close to the dumping site as well.
|
|
| 3. Arsenic
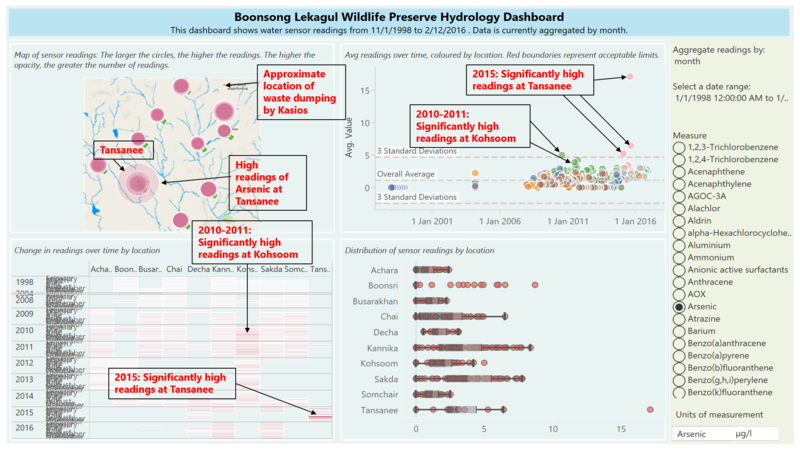
Arsenic is known to be a very toxic contaminant in soil. Stations started picking up readings of Arsenic since 2008. Levels of Arsenic stayed close to zero until 2010, where readings at Kohsoom saw a significant increase. In fact, on 26 August 2010, there was a statistically significant increase in Arsenic levels at Kohsoom. Levels remained high in 2011.
In recent times, spikes of Arsenic sensor readings were detected in Tansanee, in 2015. There was an extraordinary high reading of Arsenic at Tansanee on 13 August 2015 (17.15 ug/l). This is the highest level of Arsenic recorded in the history of the data, which is a genuine cause of concern.
|
|
| 4. Biochemical Oxygen Demand
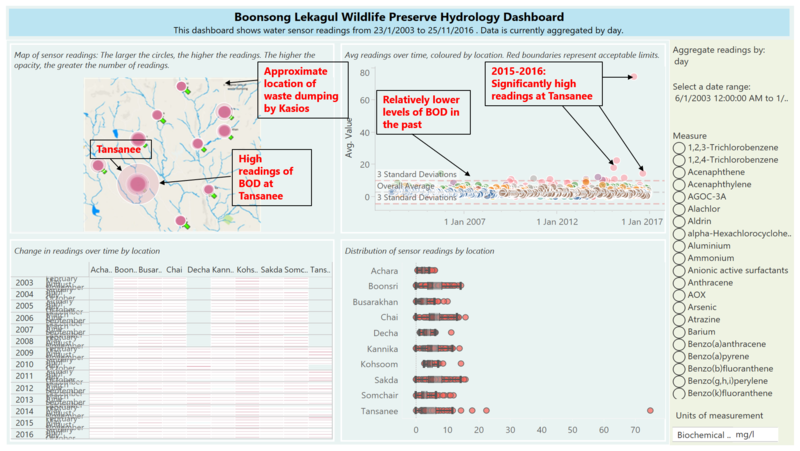
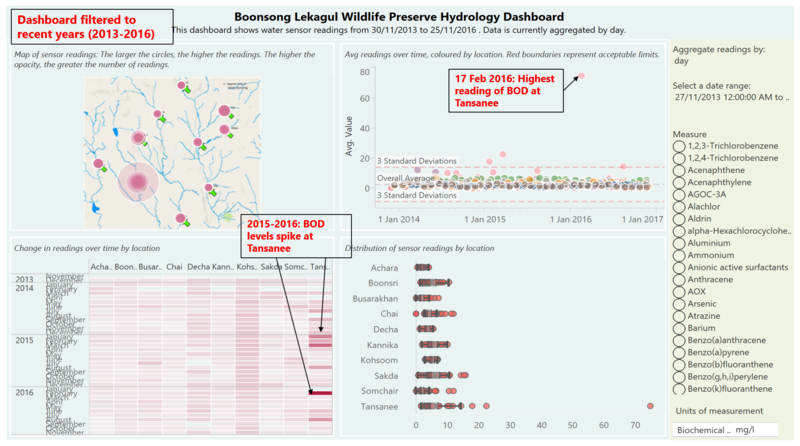
Another important indicator of water pollution is Biochemical Oxygen Demand (BOD). Rivers are considered severely polluted when levels of BOD exceed 8 mg/l. In 2015-2016, the Tansanee station has seen significant increase in BOD levels. There was an extraordinary high reading of BOD at Tansanee on 17 February 2016 (74.71 mg/l), which is of great concern as it almost 10 times above the limit mentioned earlier. The rivers at Tansanee in recent times is severely polluted.
The filtered dashboard show the spikes in BOD at Tansanee in recent times.
|
|
| 5. Chlorodinine
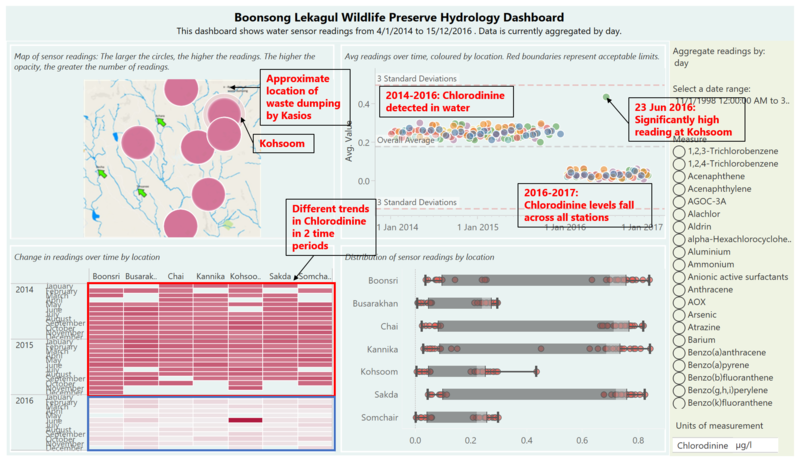
The previous VAST challenge identified chlorodinine as one of the toxic chemical contaminants produced by factories in the preserve. From 2014-2016, levels of chlorodinine were constant across all stations but then abruptly fell from 2016-2017. One possible reason for this sudden decline is the introduction of environmental regulations in the preserve. However, on 23 June 2016, there was a spike in chlorodinine readings at Kohsoom, the closest station to the location of waste dumping. It is possible that the waste dumping occurred that day and is worth an investigation.
|
|
| 6. Chromium
Another important indicator of water pollution is Biochemical Oxygen Demand (BOD). Rivers are considered severely polluted when levels of BOD exceed 8 mg/l. In 2015-2016, the Tansanee station has seen significant increase in BOD levels. There was an extraordinary high reading of BOD at Tansanee on 17 February 2016 (74.71 mg/l), which is of great concern as it almost 10 times above the limit mentioned earlier. The rivers at Tansanee in recent times is severely polluted.
The filtered dashboard show the spikes in BOD at Tansanee in recent times.
|
|
| 7. Cyanides
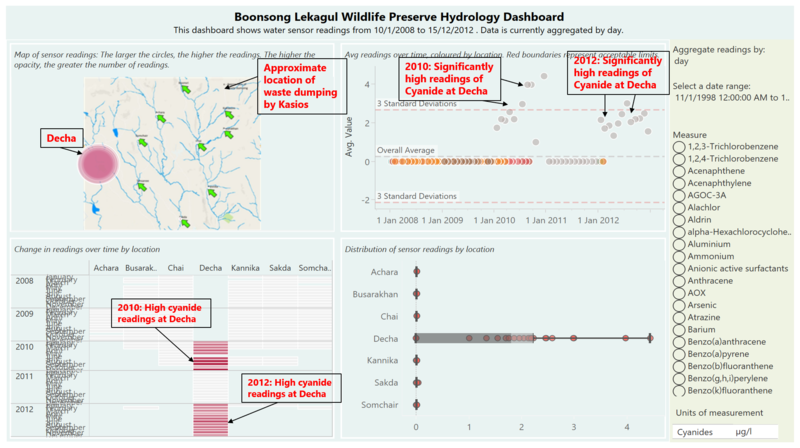
Another important indicator of water pollution is Biochemical Oxygen Demand (BOD). Rivers are considered severely polluted when levels of BOD exceed 8 mg/l. In 2015-2016, the Tansanee station has seen significant increase in BOD levels. There was an extraordinary high reading of BOD at Tansanee on 17 February 2016 (74.71 mg/l), which is of great concern as it almost 10 times above the limit mentioned earlier. The rivers at Tansanee in recent times is severely polluted.
The filtered dashboard show the spikes in BOD at Tansanee in recent times.
|
|
| 8. Iron
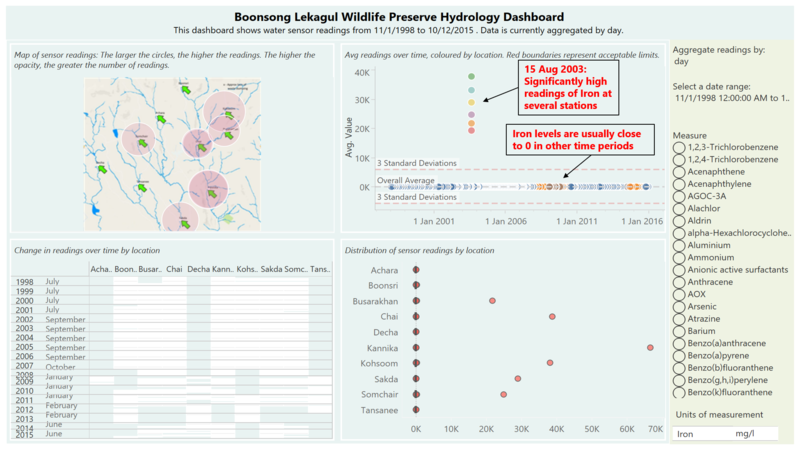
Another important indicator of water pollution is Biochemical Oxygen Demand (BOD). Rivers are considered severely polluted when levels of BOD exceed 8 mg/l. In 2015-2016, the Tansanee station has seen significant increase in BOD levels. There was an extraordinary high reading of BOD at Tansanee on 17 February 2016 (74.71 mg/l), which is of great concern as it almost 10 times above the limit mentioned earlier. The rivers at Tansanee in recent times is severely polluted.
The filtered dashboard show the spikes in BOD at Tansanee in recent times.
|
|
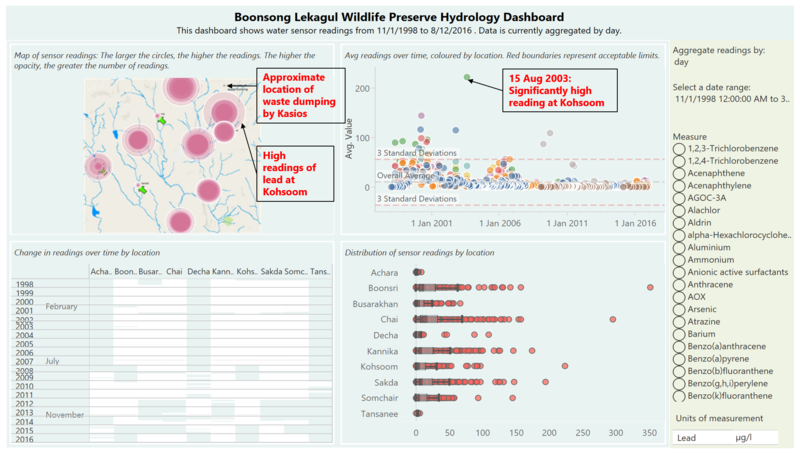
| 9. Lead
Another important indicator of water pollution is Biochemical Oxygen Demand (BOD). Rivers are considered severely polluted when levels of BOD exceed 8 mg/l. In 2015-2016, the Tansanee station has seen significant increase in BOD levels. There was an extraordinary high reading of BOD at Tansanee on 17 February 2016 (74.71 mg/l), which is of great concern as it almost 10 times above the limit mentioned earlier. The rivers at Tansanee in recent times is severely polluted.
The filtered dashboard show the spikes in BOD at Tansanee in recent times.
|
|
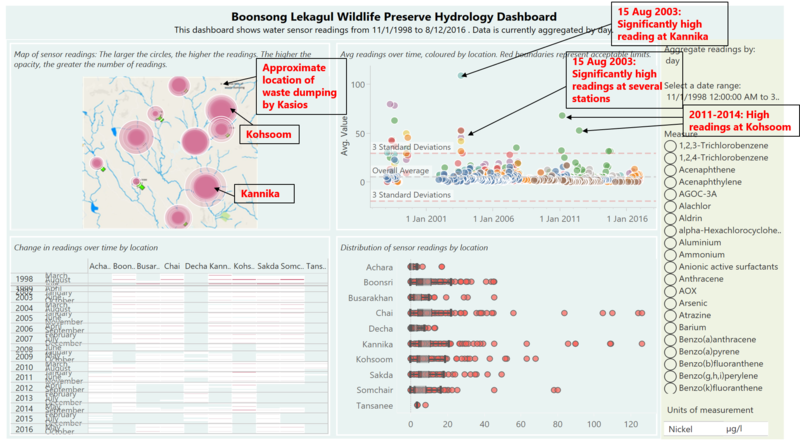
| 10. Nickel
Another important indicator of water pollution is Biochemical Oxygen Demand (BOD). Rivers are considered severely polluted when levels of BOD exceed 8 mg/l. In 2015-2016, the Tansanee station has seen significant increase in BOD levels. There was an extraordinary high reading of BOD at Tansanee on 17 February 2016 (74.71 mg/l), which is of great concern as it almost 10 times above the limit mentioned earlier. The rivers at Tansanee in recent times is severely polluted.
The filtered dashboard show the spikes in BOD at Tansanee in recent times.
|
|
|

