ISSS608 2017-18 T3 Assign Lim Wee Kiong Insights
|
|
|
|
|
|
|
Contents
Question 1
Characterize the past and most recent situation with respect to chemical contamination in the Boonsong Lekagul waterways. Do you see any trends of possible interest in this investigation?
Insights from Data Visualization
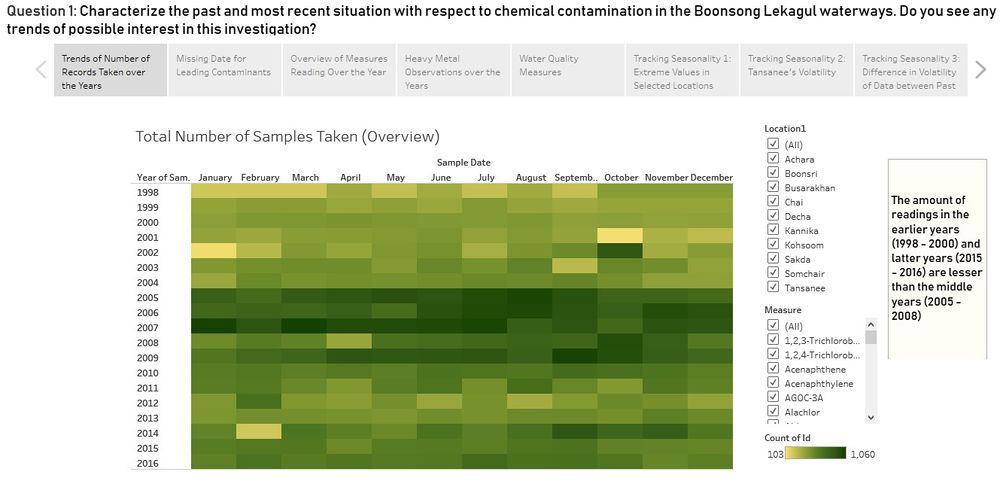
The amount of readings taken over the years are uneven. There seem to be less readings in the distant past and the recent times, while more readings were taken of the middle years [2005 – 2008].
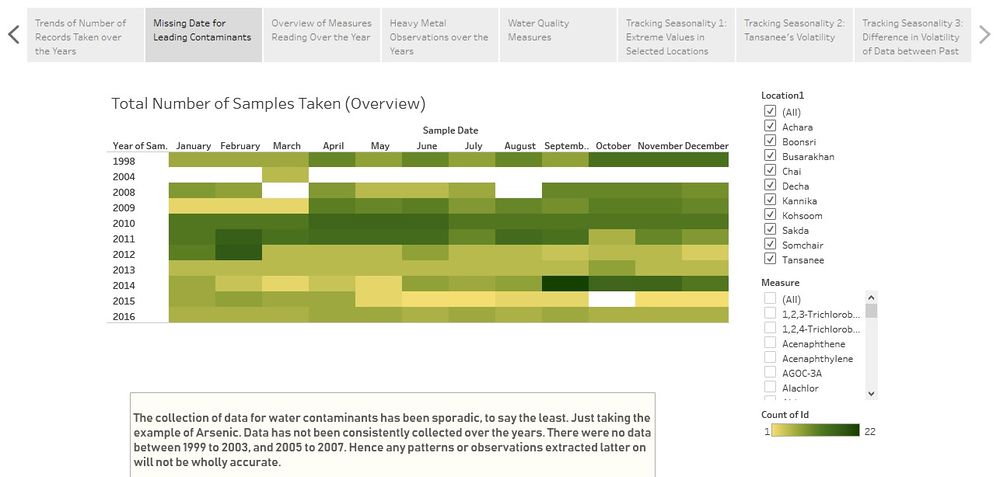
Taking an example of arsenic, data collection has also been sporadic. There are no data taken between 1999 to 2003, and 2005 to 2007. Extracting patterns from missing data will be inaccurate.
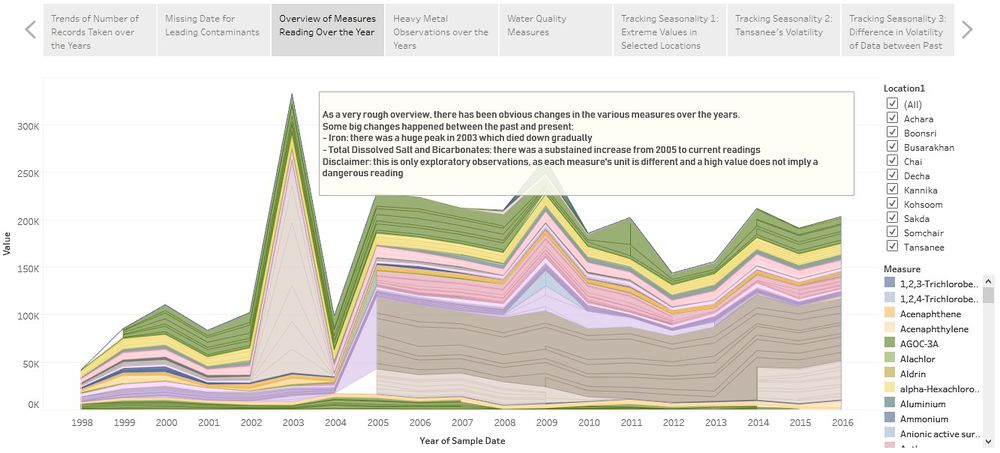
In an overview chart of all the measures taken for all locations, we can see that some values had huge peaks at certain times, e.g. iron in 2003 and increased deposits of dissolved salts from 2005. This data is inconclusive unless we delve deeper into each location and examine their seasonality.
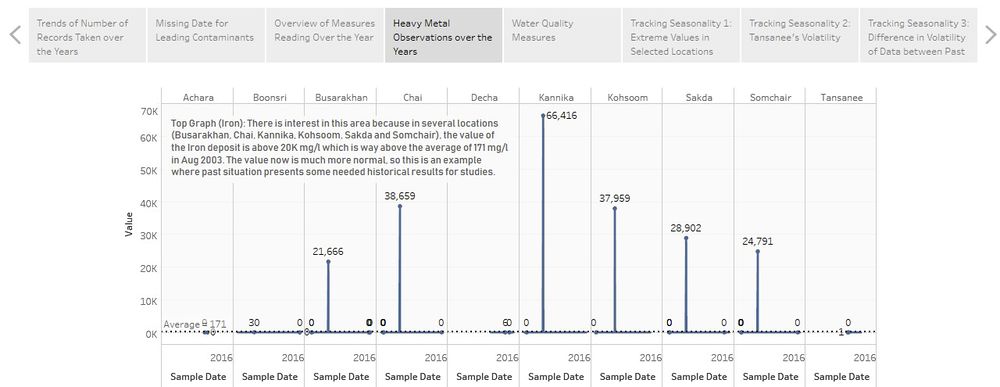
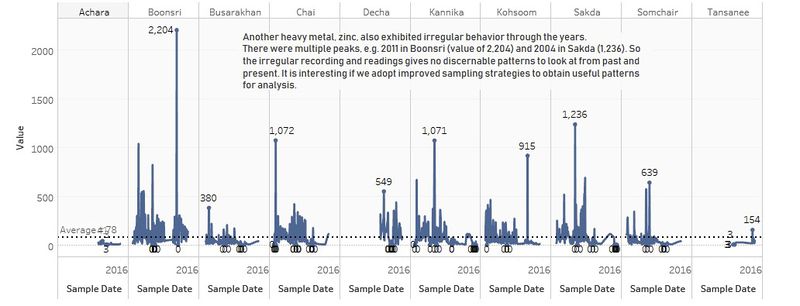
For instance, heavy metals such as iron and zinc had interesting observations by comparing the past and present. These metals are potentially dangerous when found in high quantity in water.
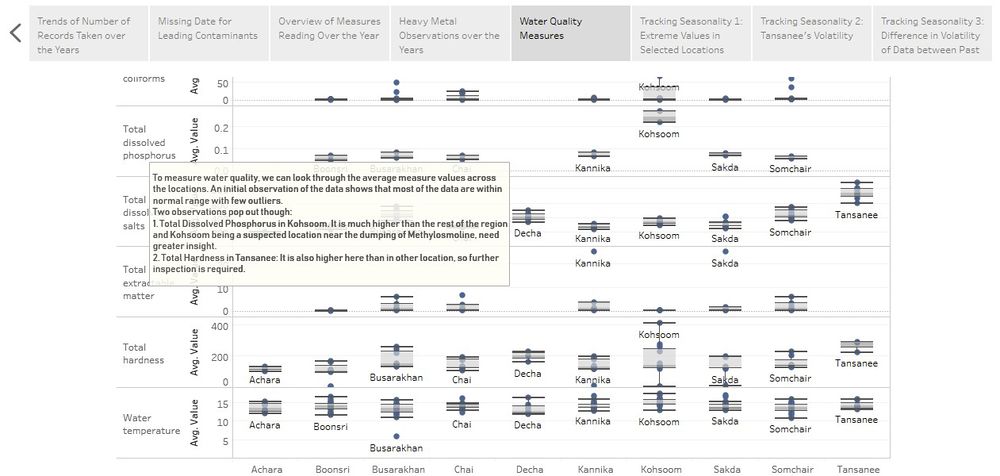
Water Quality Measures are important as well, as dissolved minerals in high quantity could result in bacteria and viruses permeating through water, where animals and people can drink and be harmed.
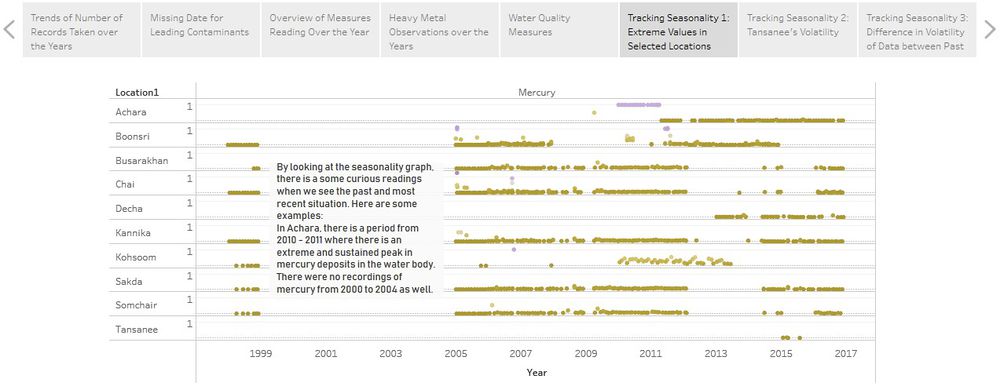
When I looked at the seasonality of each measure over all the locations, we can find different trends between the past and present. For example, in selected locations, e.g. Achara, I found elevated levels of mercury from 2010 – 2011.
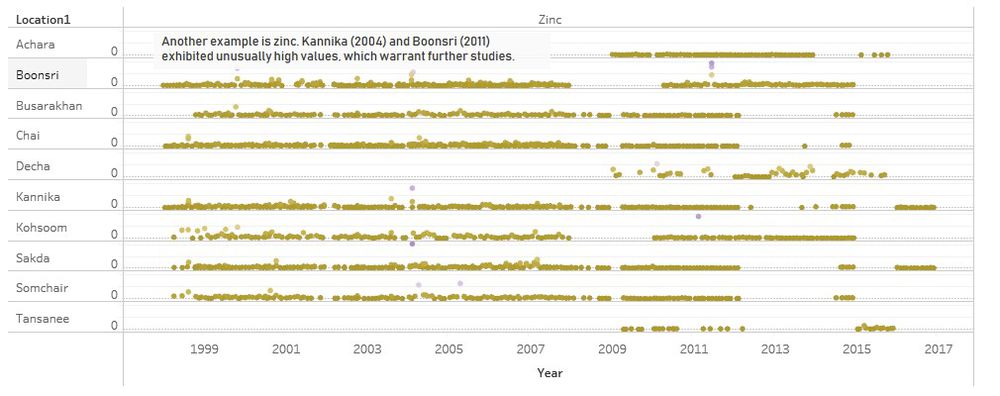
Or high levels of zinc in Kannika and Boonsri:
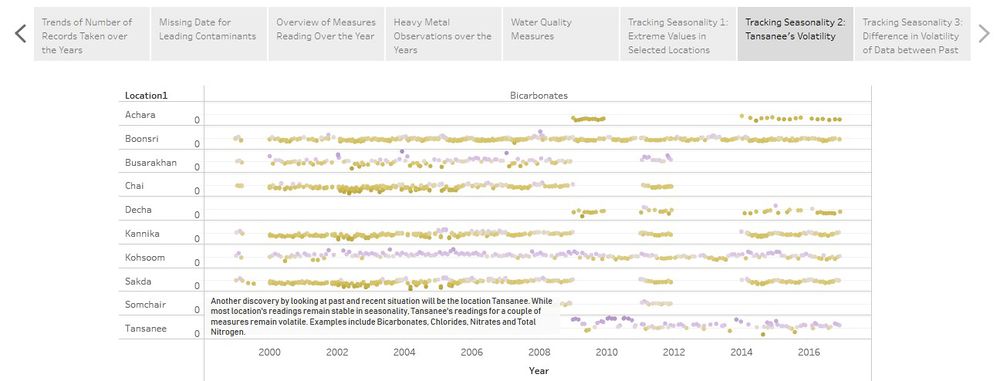
I also saw increased volatility in one location: Tansanee. The volatility seems to be apparent in a couple of measures: bicarbonates, chlorides, nitrates and total nitrogen.
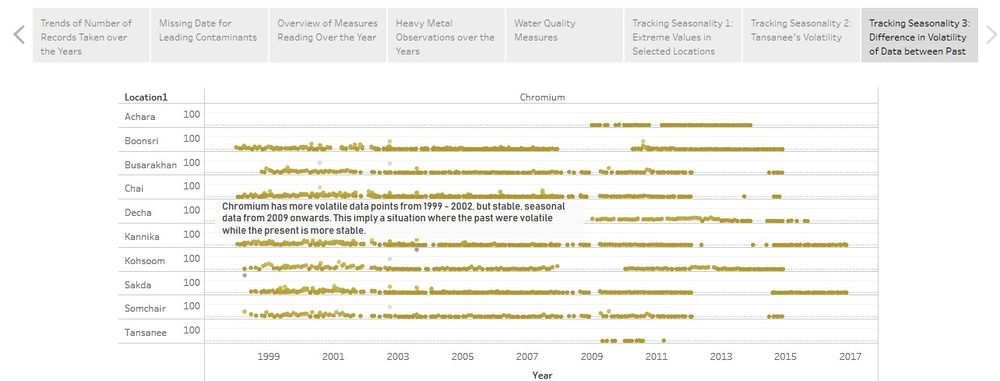
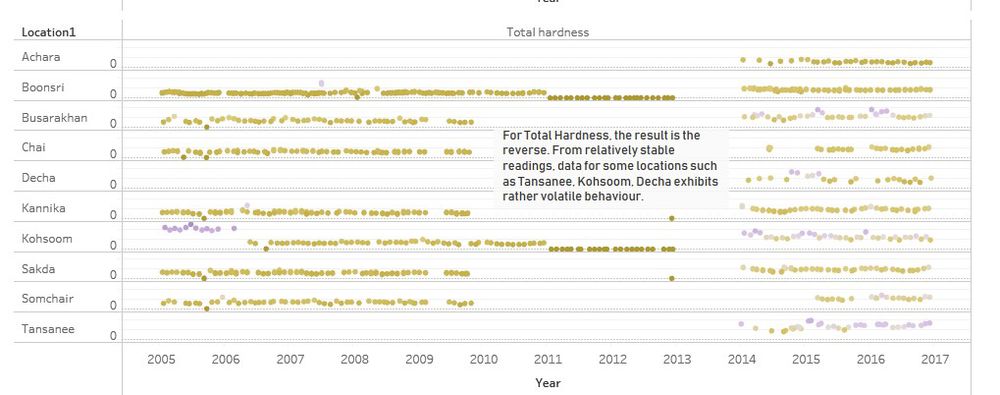
The last observations for seasonality is that some data exhibit unstable readings in the early years and stable readings recently, e.g. chromium, and the reverse behaviour for some, e.g. total hardness. Water conditions differ through the years and over the different regions constantly.
Summary from Insights
The readings do not show consistent behaviour from the past to present. There are times when measures stabilized and in other times, the reverse happen. Some areas have missing data from the past but exhibit curious behaviour in the present, e.g. Tansanee. It is definitely worthwhile to investigate all these phenomena in greater details. Which leads us to the next question… can we improve the sampling process?
Question 2
What anomalies do you find in the waterway samples dataset? How do these affect your analysis of potential problems to the environment? Is the Hydrology Department collecting sufficient data to understand the comprehensive situation across the Preserve? What changes would you propose to make in the sampling approach to best understand the situation?
Insight from Data Visualization
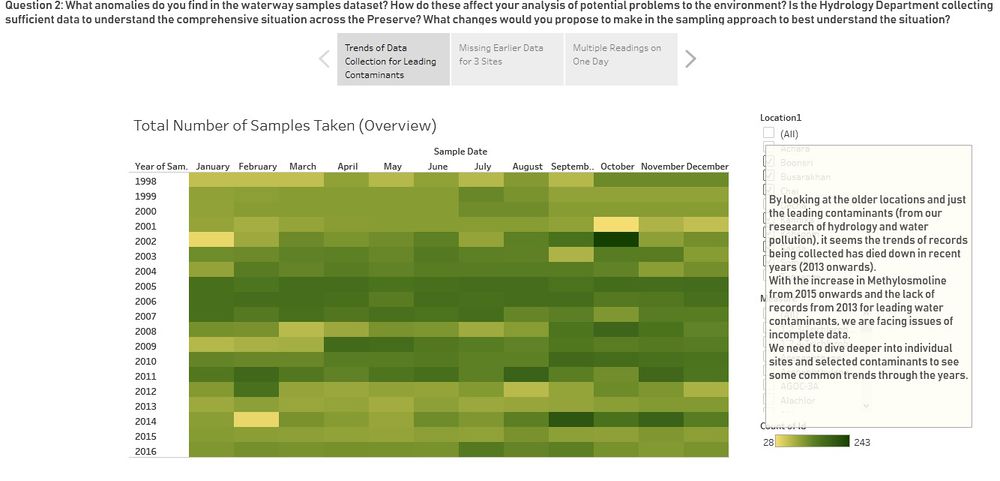
As discovered from the last question, the data collected are uneven and irregular. From the Calendar plot, we can see that there are times when more data was collected and time when the collection is very low.
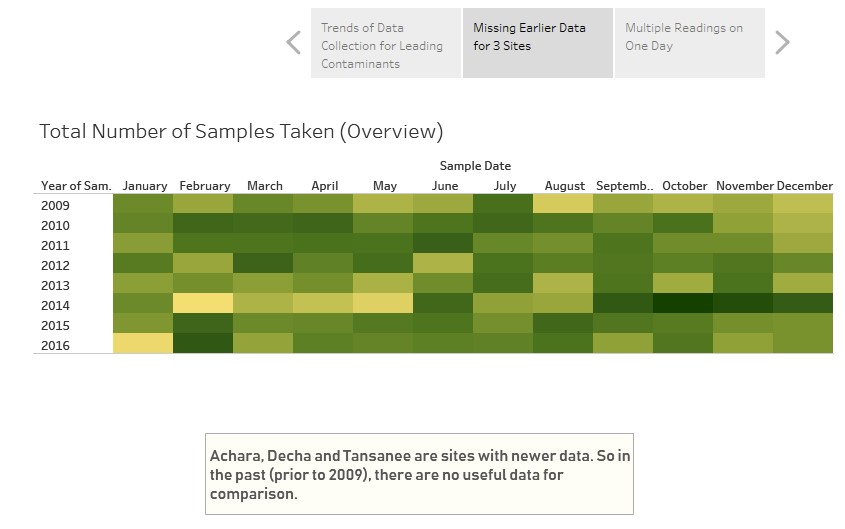
It is also curious that for three sites, there were no data collected before 2009. It is probably due to water sensors being installed at a later stage.
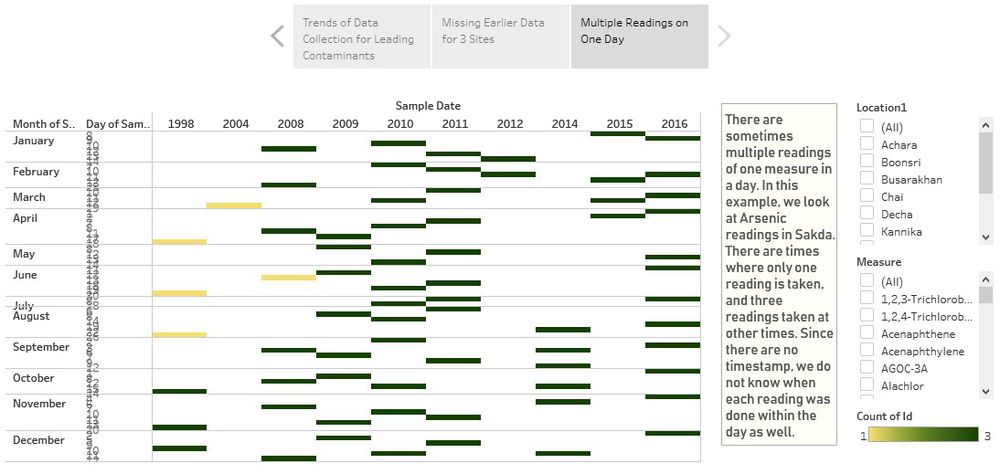
Another major problem with the data is the lack of timestamping. It is found that for certain measures for specific locations, there could have been multiple readings taken. But as there were no time stamp, we would not know the exact change in reading throughout the day for that measure. In this example, there were 0 – 3 readings taken for arsenic in Sakda over the period of observation.
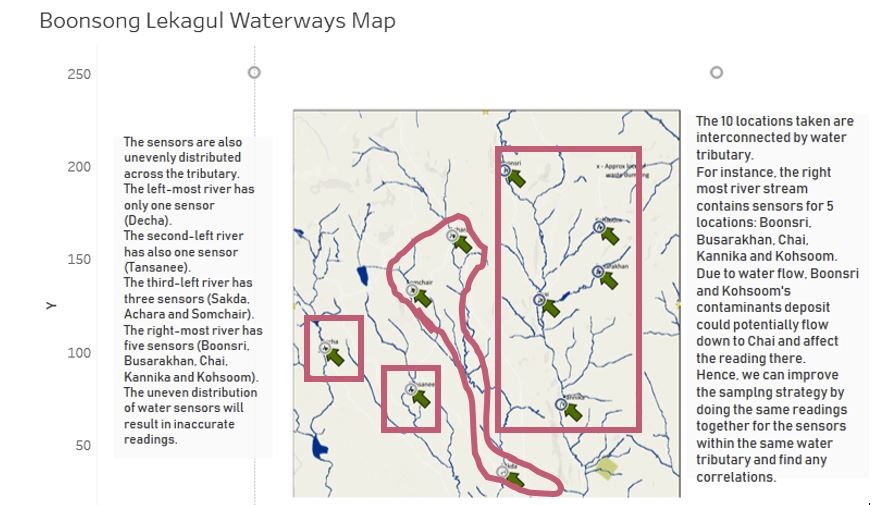
Another observation made is with regards to the placement of water sensors. Water readings are highly influenced by water tributaries and some of the sensors are connected to one another. The ten locations can be separated into four clusters (the red boxes below denote the 4 clusters). For instance, one cluster had 5 sensors and their readings may be interdependent.
Summary from Insights
The anomalies arise from the lack of data and irregular reading of the data. This is due to two factors:
- Lack of resources to constantly read the data
- Uneven distribution of water sensors over the four river streams
Also, if we have the avenue to overlay the Kasios factory location over the data, we can probably find out more correlations between the factory discharge and the water measure readings.
My recommended changes to the sampling approach include:
1. Additional water sensors for each main river streams and at least one sensor at each major tributary
2. Due to resource issues, to focus the reading on critical water contaminants (as I have outlined in the data preparation portion)
3. Reduced but focused reading of data. Since the water data are largely seasonal, one way to reduce effort is to focus the reading for the data over a focused period. We can do 3 – 5 measures for all locations from Jan – Mar, and switch to another 3 – 5 measures. This will help to alleviate the stress of limited resources yet provide a better apple-to-apple comparison.
Now that we understand the shortcoming of this data set, our primary problem has not been solved yet. Are the water data showing anything that is related to the beautiful birds?
Question 3
After reviewing the data, do any of your findings cause particular concern for the Pipit or other wildlife? Would you suggest any changes in the sampling strategy to better understand the waterways situation in the Preserve?
Insights from Data Visualization
The culprit in question: Methylosmoline.
The data does not stretch a long time into the past, and it is fairly recent. There is a sharp increase in the data for both Kohsoom and Somchair, with Chai having a higher than average reading as well.
Back to Dropbox Page
