ISSS608 2017-18 T3 Assign Lim Wee Kiong Insights
|
|
|
|
|
|
|
Question 1
Characterize the past and most recent situation with respect to chemical contamination in the Boonsong Lekagul waterways. Do you see any trends of possible interest in this investigation?
Insights from Data Visualization
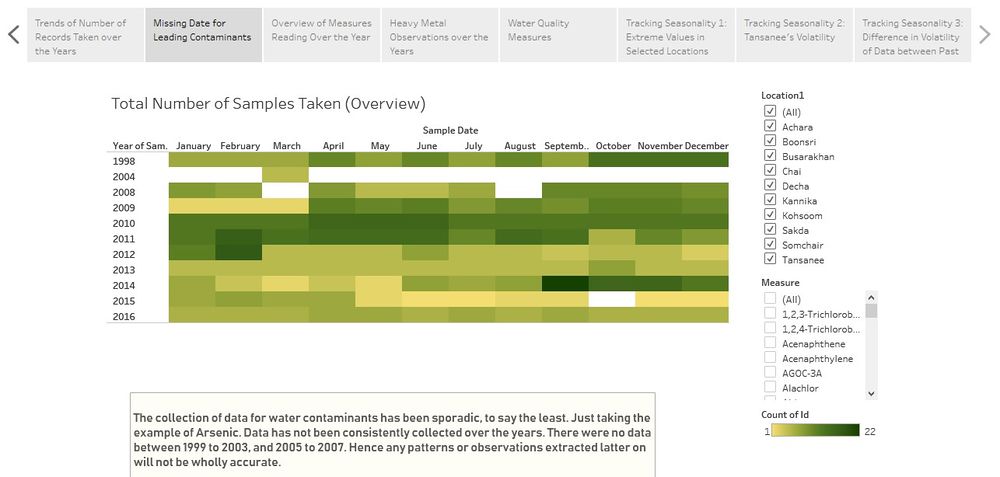
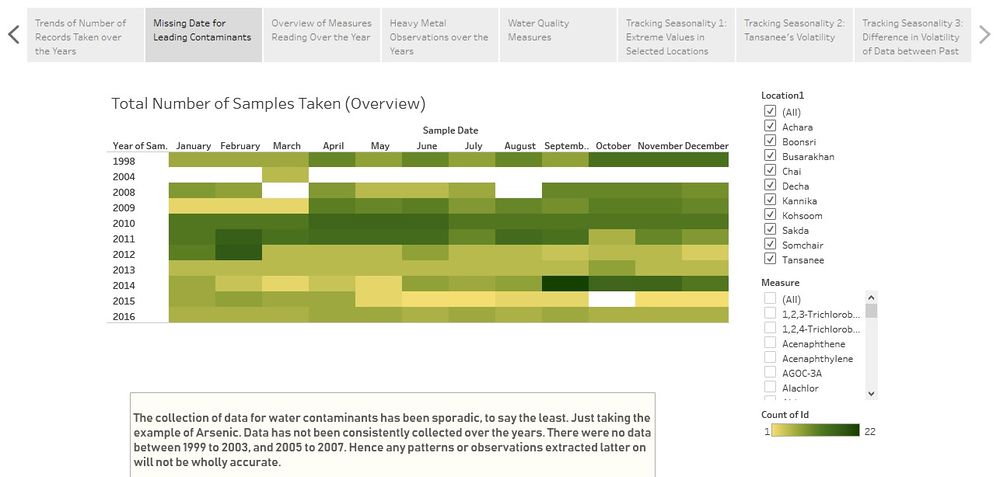
The amount of readings taken over the years are uneven. There seem to be less readings in the distant past and the recent times, while more readings were taken of the middle years [2005 – 2008].
Taking an example of arsenic, data collection has also been sporadic. There are no data taken between 1999 to 2003, and 2005 to 2007. Extracting patterns from missing data will be inaccurate.
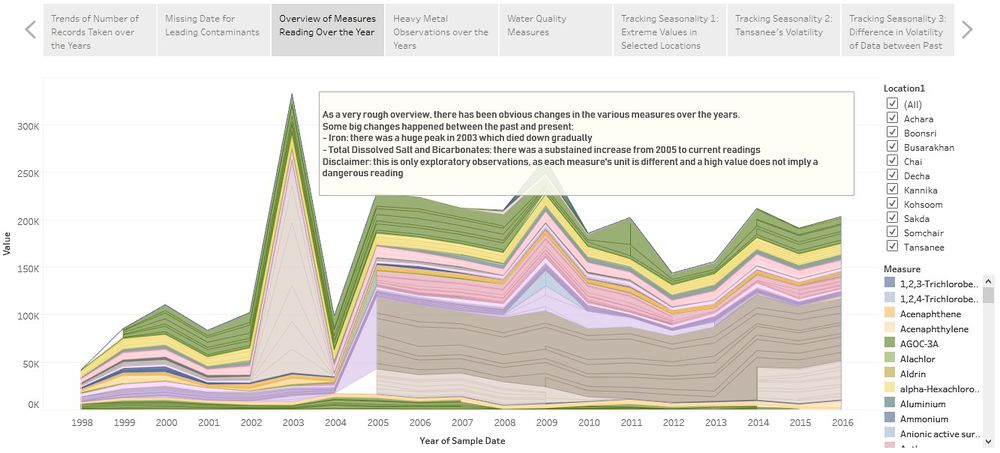
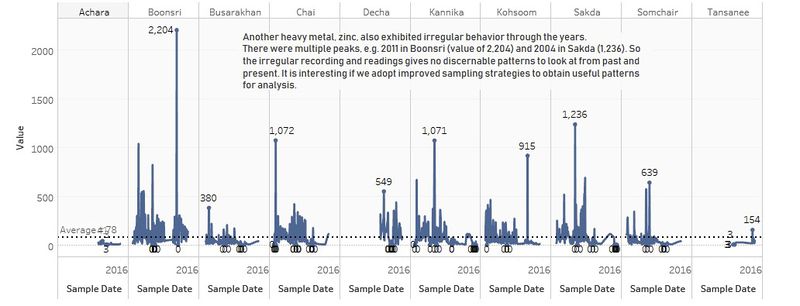
In an overview chart of all the measures taken for all locations, we can see that some values had huge peaks at certain times, e.g. iron in 2003 and increased deposits of dissolved salts from 2005. This data is inconclusive unless we delve deeper into each location and examine their seasonality.
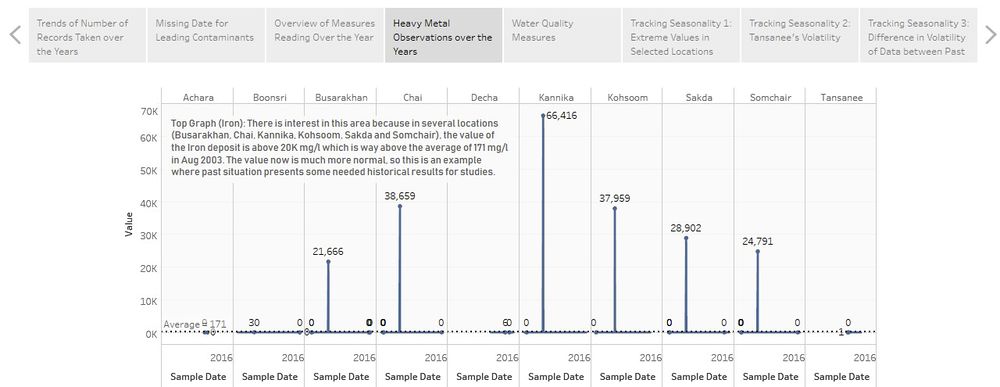
For instance, heavy metals such as iron and zinc had interesting observations by comparing the past and present. These metals are potentially dangerous when found in high quantity in water.
Back to Dropbox Page

