Group12 Report
 Have the Nations really progressed ?
|
|
|
|
|
|
|
Report
Contents
Introduction
World Development Indicators (WDI) is the primary World Bank collection of development indicators, compiled from officially recognized international sources. It presents the most current and accurate global development data available including national, regional and global estimates. It covers more than 7 million data points collected over the span of 58 years. This statistical reference includes over 1500 indicators covering more than 200 economies. The annual publication is released in April of each year.
The massive amount of world development data has by far exceeds the ability for students, policymakers, analysts and officials to transform the data into proper visualization for analysing and gaining insight of the global developmental landscape. Thus, creating an adverse impact on the financial and technical assistance World Bank is providing to the developing countries around the world.
Through our visualizations, we seek to utilize existing data to derive meaningful insights over how various socioeconomic factors have had an impact on development of different nations and to tell their story of growth and downfall across years. This dashboard also helps decide on various areas the countries need help on and has the aid provided earlier has any effect or not. The Key objective is to deep dive in a countries development across 9 parameters.
Motivation and Objective
Our main objective is to utilize visual and graphical techniques in R for preparation of a user-friendly dashboard. Countries requiring aid from various organizations would receive benefit from this analysis by their performances being gauged over the years from which they first received assistance. Furthermore, analysts get the option to switch between different forms of visualization to allow them to make better financial and technical decision in helping the developing countries. This application should enable financial aid providers to decide on funding future aid or ROI on existing aid given.
Previous Works
Sustainable Development Goals
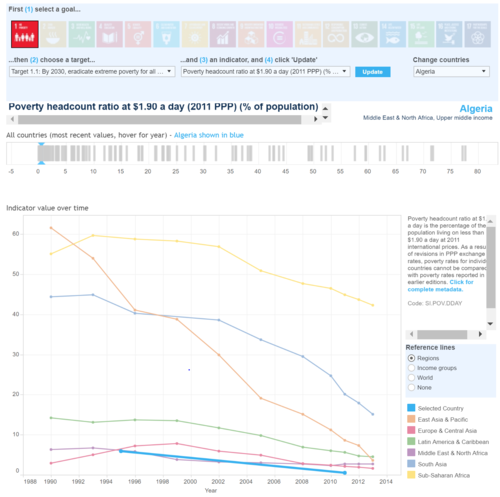
World Bank website has a dashboard in place with respect to Sustainable Development goals, which contains more than 15 different goals to visualize for all the countries in view of different measures on a line chart covered over various regions. The dashboard is too complicated and requires an expert view of the exact goal to visualize.
CRAN Download Monitor
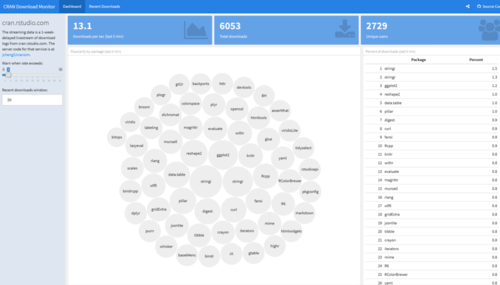
For our dashboard design, we were inspired by the CRAN Download monitor to perform reactive output based on input parameters.
Google Charts Demo

We attempted to create the charts with an easy interface for users to see the aesthetics in an appealing manner.
Dataset & Preparation
Raw Data
- We exported the World Development Index "Data". from world bank database from their World Development Indicators and Sustainable Development Goals section with 1580 parameters across 58 years and 217 countries. The data set was very large (19.9 Million Rows) and many metrics did not make sense. We selectively filtered all the measures into 9 categories we thought are the most impactful. We then merged the data into a single file across 58 years and the UN recognized 201 countries.
