Group13 Proposal
Economic Growth And Climate Change
|
|
|
|
|
Introduction
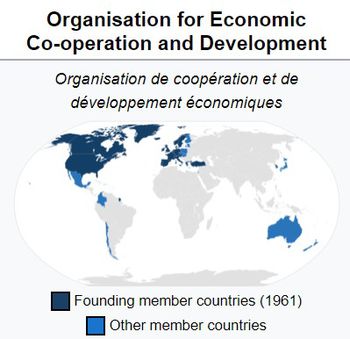
The Organization for Economic Co-operation and Development is an intergovernmental economic organization with 37 member countries, founded in 1961 to stimulate economic progress and world trade. Most OECD members are high-income economies with a very high Human Development Index (HDI) and are regarded as developed countries. As of 2017, the OECD member states collectively comprised 62.2% of global nominal GDP (US$49.6 trillion) and 42.8% of global GDP ($54.2 trillion) at purchasing power parity.
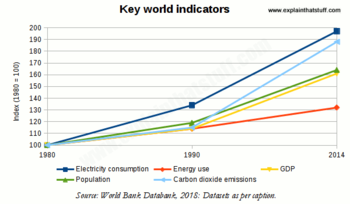
But has this economic progress come at a cost? During this period, the reported green house gas (GHG) emissions has shown a rising trend. For instance, there was a large decrease in GHG emissions in 2009 due to economic recession, further enforcing our fears that human activities could have drastic impact on climate change. However, can the overall trend in GHG emissions be certainly attributed to changes in economic activity? Is there a clear convergence between economic activity and GHG emissions, resulting in a strong downward or upward trend in the GHG emissions intensity of economic activity, measured as GHG emissions per unit of GDP.
This data-viz project report uncovers some facts for the world leaders to ponder over and take decisive measures before we cause an irreversible damage to a planet we call "home".
Motivation
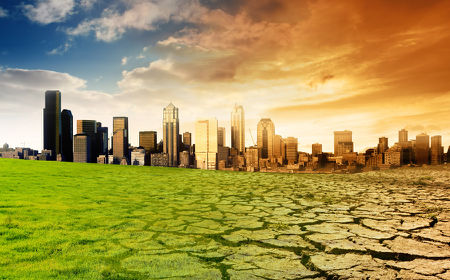
Climate hazards are natural events in weather cycles. We’ve always had hurricanes and droughts, flooding and high winds. However, we are currently witnessing a scale of destruction and devastation that is new and terrifying. 2017 alone has seen a series of devastating climate disasters in various parts of the world, extreme weather events such as Hurricane Irma, deadly heat waves in India, Europe and elsewhere, and flooding in south-east Asia. From Houston to Mumbai, millions of homes are underwater or blown over, and millions of people are homeless and impoverished. The evidence is overwhelming:
- Average of 400 “extreme weather events” every year
- Since June 2017, roughly 41 million people have been affected by flooding
- More than 150 million people live on land that will be below sea level or regular flood levels by the end of the century.
- Growing storm surges and tsunamis threaten nearly a quarter of the world’s population.
In past few years, world leaders have come together to bring all nations together to undertake ambitious efforts to combat climate change. Through this project, we aim to provide more evidence on climate change and economic development. We hope to contribute to growing issue of climate change and possibly spread more awareness among people around the globe.
Main Objectives
The main objectives for this project are as listed:
Driving Forces behind Climate Change: Through interactive visualization, we aim to study trends in potential economic, science and technology, and climate change indicators over the last 2 decades. We will try to uncover relationship between climate change and economic factors. Since science and technology has advanced significantly during this period, we would like to find out its impact on climate and economic advancement.
Implement Forecast Model for Policymakers: Using R Shiny and Tableau, we want to implement forecast model, driven by interactive visualization, to help policy makers take timely and corrective actions towards climate change.
Visualization Tools
For our analysis, we propose to carry out interactive visualisation using Tableau, Excel, JMP in addition to R involving following packages:
- shiny
- shinydashboard
- heatmaply
- RColorBrewer
- tidyverse
- tm
- wordcloud
- maps
- circlize
- migest
- plotly
- seriation
- dendextend
- GGally
- sf
- tmap
Dataset Description
With a deep dive into the corresponding pollutant type, activity and measure, the core of our analysis will be around following 3 Environment data-sets:
- http://stats.ukdataservice.ac.uk/ -> OECD -> Environment Statistics -> Air and Climate -> Air Emission Accounts
- http://stats.ukdataservice.ac.uk/ -> OECD -> Environment Statistics -> Air and Climate -> Emissions of Air Pollutants
- http://stats.ukdataservice.ac.uk/ -> OECD -> Environment Statistics -> Air and Climate -> Greenhouse Gas Emissions
We will also try to draw parallels of our analysis of environment statistics with a completely independent International Monetary Fund data-set to track growth measures in OECD countries:
- http://stats.ukdataservice.ac.uk/ -> International Monetary Fund-> World Economic Outlook
The following is a high-level overview of our aggregated data-source. We will update the below table once we have have finalized the list of potential indicators for analysis.
| Indicator Name | Description |
|---|---|
| GDP | Gross Domestic Product Per Capita |
| GERD | Gross Domestic Expense on R&D |
| Population | Population by Country |
| CO2_E | Carbon Dioxide Emissions |
| CO2_M | Co2 Emissions for Manufacturing Sector |
References
- [1] The Elements of Statistical Learning : Data Mining, Inference, and Prediction, Second Edition, By (author) Trevor Hastie , By (author) Jerome Friedman , By (author) Robert Tibshirani
- [2] Naked Statistics : Stripping the Dread from the Data, By (author) Charles Wheelan
- [3] Storytelling with Data : A Data Visualization Guide for Business Professionals, By (author) Cole Nussbaumer Knaflic
- [4] https://en.wikipedia.org/wiki/OECD
- [5] R for Data Science, By (author) Hadley Wickham , By (author) Garrett Grolemund
- [6] http://www.datacamp.com


