ISSS608 2018-19 T3 Assign PARAM GADHAIYA Insights
|
|
|
|
|
Question 1.
Characterize the past and most recent situation with respect to chemical contamination in the Boonsong Lekagul waterways. Do you see any trends of possible interest in this investigation? Your submission for this questions should contain no more than 10 images and 1000 words.
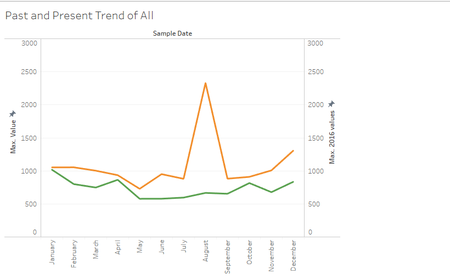
The graph below shows the trend of maximum chemical contamination over the years with the maximum chemical contamination in 2016. Overall, we observe that the maximum chemical contamination in 2016 was less than the overall maximum. In short, 2016 was not the year that contributed to the highest chemical contamination in Boonsong Lekagul Waterways. However, we do observe that chemical levels in 2016 were high in the month of April and October in the year 2016.
Biochemical Oxygen and Chemical Oxygen
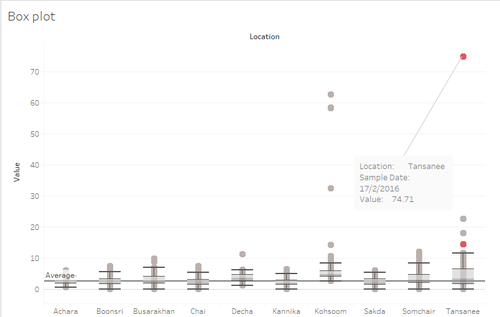
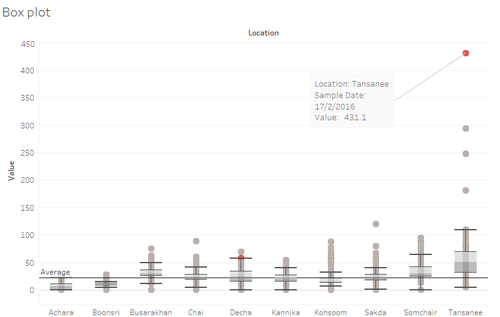
Unusually high amount of Biochemical Oxygen and Chemical Oxygen found on Tansanee region. Sample taken on 17th February 2016 showed excessive high content of these chemicals in the water.
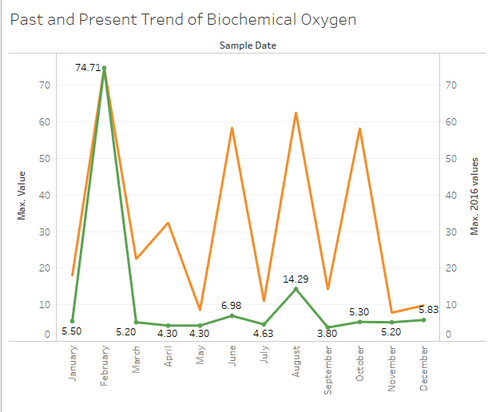
Comparing the overall trend of Biochemical Oxygen in water to the 2016 trend, we observe that for all the other months except February, the maximum amount of chemical contamination is way below the maximum amount of chemical contamination of all the years. However, Biochemical Oxygen levels reached their peak in Feb 2016 (its highest ever) with a value of 74.71.
Comparing the overall trend of Chemical Oxygen Demand to its 2016 trend, we observe in 2016 the maximum Chemical Oxygen levels are way below the overall maximum except for February (highest ever) and March where the maximum in 2016 is just slightly below the overall maximum.
Cholorodinine
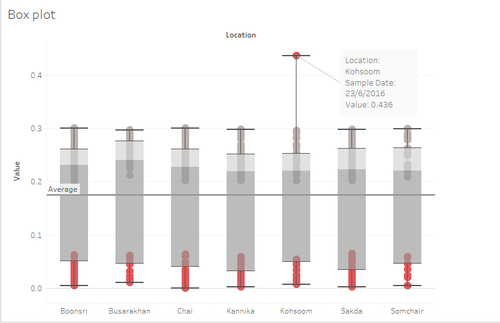
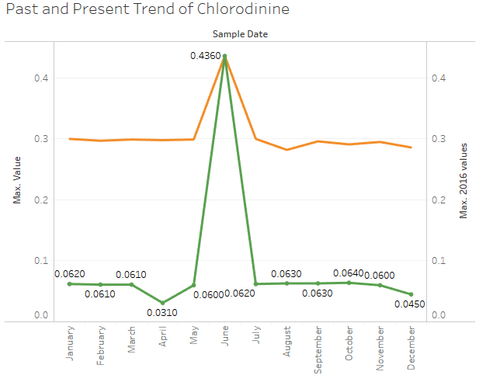
Unusually high spike in the Cholorodinine content found in Kohsoom region in the month of June in 2016. Comparing the overall maximum with the 2016 maximum values, we observe that all for all the months except June, the chemical content is way below the maximum chemical contamination in the past.
Methylosmoline
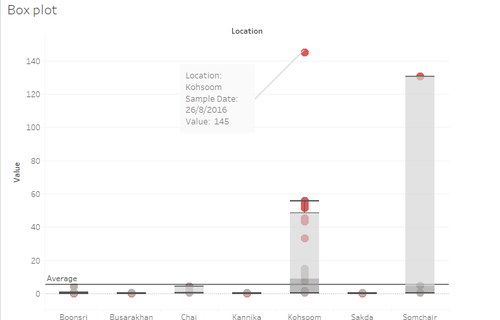
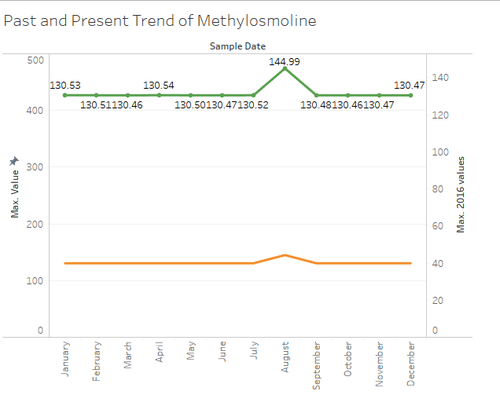
Overall, we see a spike in the chemical levels of Methylosmoline in 2016 samples. The highest ever was found in Kohsoom region in the month of August. We also observe that there is a massive increase in level of chemical in Somchair region taken in April 2016. Looking at the overall and the recent trend, we observe that maximum level of chemicals in 2016 is way higher than the overall trend. Kohsoom shows the highest amount of increase in level of chemicals in 2016.
Potassium
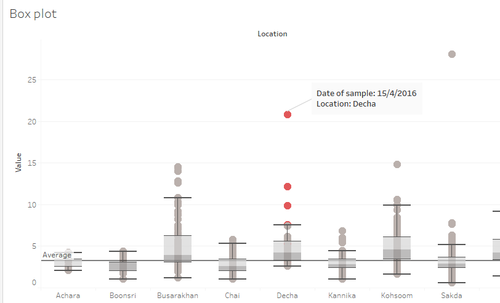
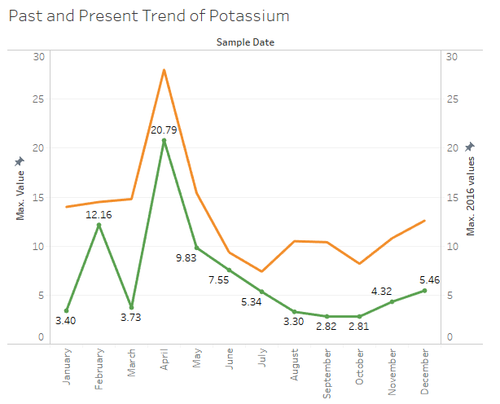
An unusual increase is found in the Decha region on 15th April 2016. In the month of February and May as well, readings had chemical content greater than the average readings. The maximum value of chemical content in 2016 is way below the overall maximum chemical content. The highest reading was taken in April 2014 with a value of 28 in the Sakda region.
Total Dissolved Phosphorous
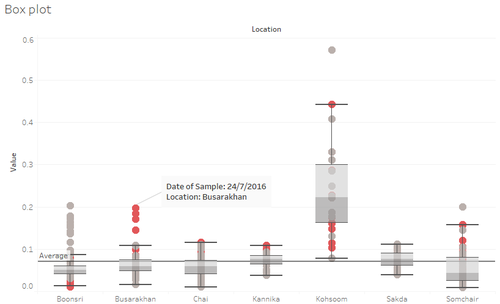
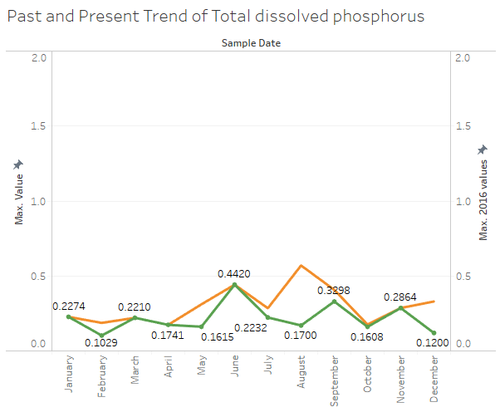
A significant increase in the level of Dissolved phosphorous is observed in Busarakhan, Kannika, Somchair, Chai and Kohsoom region. The highest reading in Busarakhan was taken on 24th July 2016. Kohsoom records the highest reading in 2016, however the highest ever reading was taken in 2015. While comparing the overall trend with 2016 readings, we observe that January, March, June, October and November have the maximum values equal to the overall maximum.
Other Chemicals
Oxygen Saturation
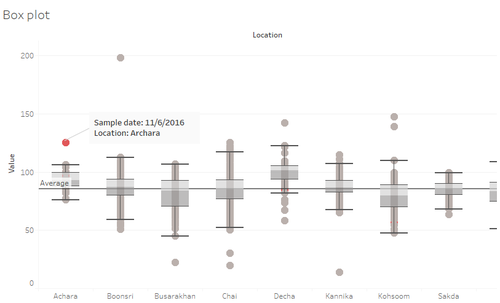
Increase in Oxygen Saturation content in Archara region on 11th June.
Dissolved Salts
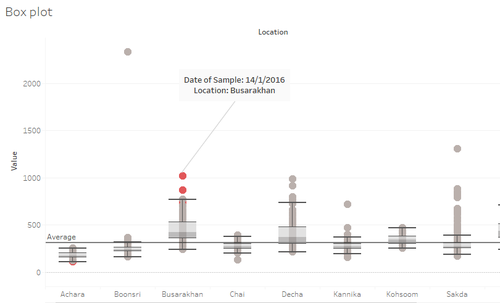
Increase in Dissolved salts content in 2016 in Busarakhan region
Total Hardness
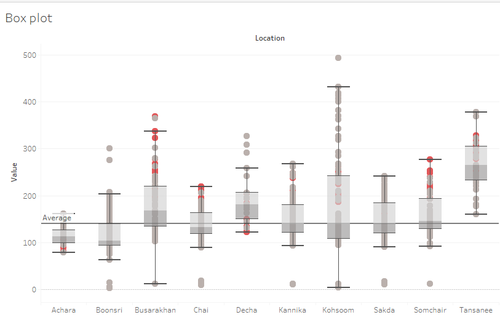
Overall increase in total hardness content in Busarakhan, Chair, Somchair region.
Question 2.
Question 3.
After reviewing the data, do any of your findings cause concern for the Pipit or other wildlife? Would you suggest any changes in the sampling strategy to better understand the waterways situation in the Preserve? Your submission for this question should contain no more than 6 images and 500 words.
To check if there is any concern for the Pipit or other wildlife, we need to assess the quality of water. There are several water quality indicators (report: LCRA) that helps us to investigate the nutrition enrichment in water and potential sign of water pollution.
Dissolved Oxygen
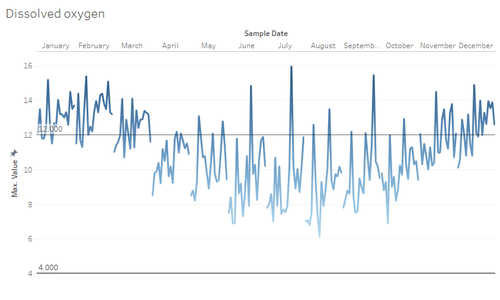
Overall, we observe in January and February the level of water temperature is higher than the expected level. July has the highest dissolved oxygen for a year. December is one of the months (January and February) where the water temperature in 2016 is higher than the expected level.
Water Temperature by Seasonality
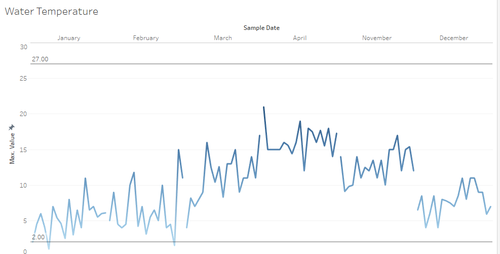
Looking at the trend of water temperature from May to October, we observe that overall in October and a few years in May (1998- 2003) and September (1998-2000) the level of water temperature is below the expected level. In July 2004, the water temperature soared higher than the expected level of water temperature to 36.40 degrees Celsius.
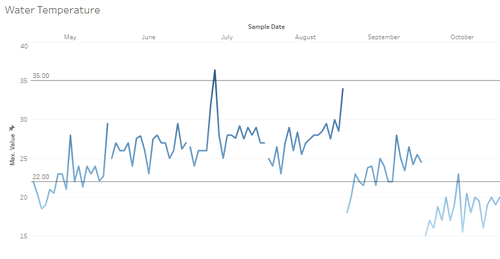
From the trend of water temperature from January to December, we observe that the water temperature in the January for the year 2002 and February 2014 falls below the expected levels. Overall, April has the highest levels of Water temperature.
