ISSS608 2017-18 T3 Assign Hasanli Orkhan Insights
|
|
|
|
|
Changes over time in the company.Is the company growing?
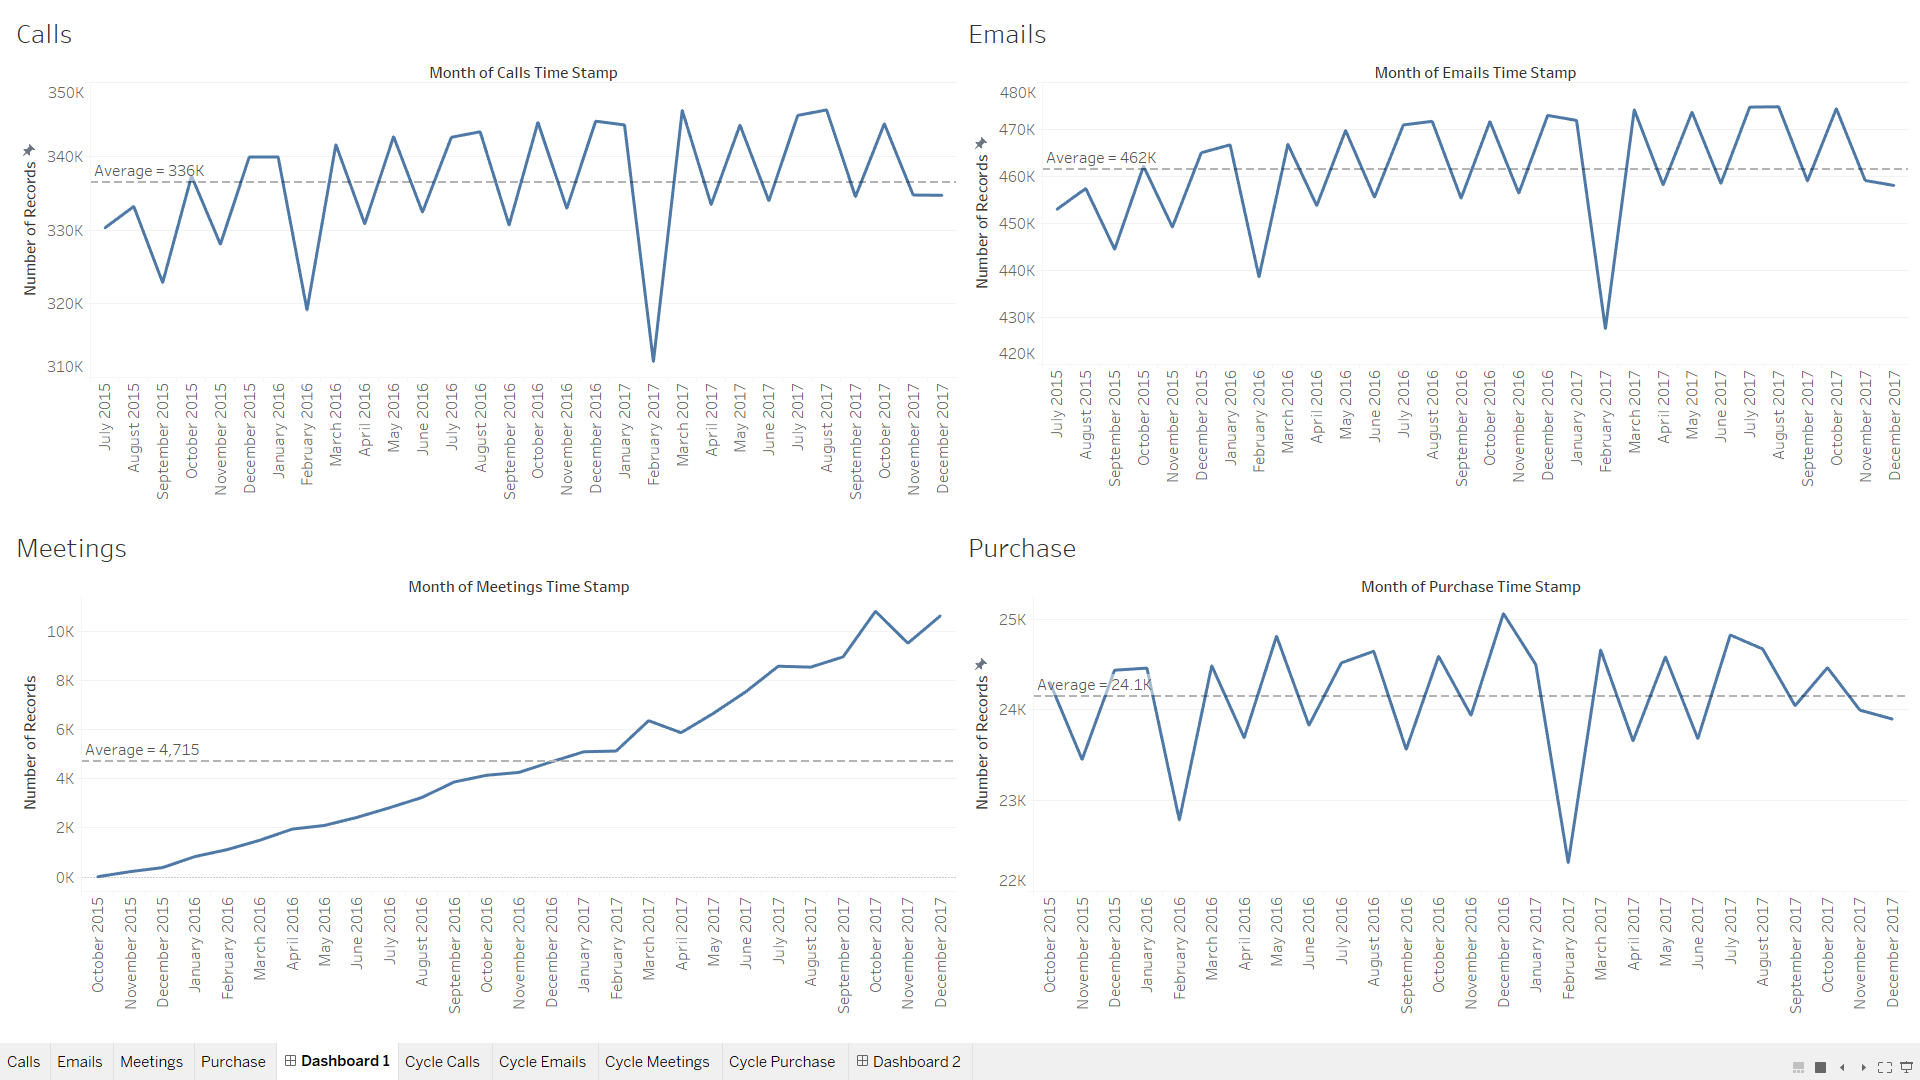
By looking at the overall trend we can compare absolute numbers and see that during 2.5 years the number of Emails always were higher than other communication types and average number of emails was 462K, whereas Calls which following the Emails on average showing 336K throughout the period. There is some obvious fluctuations depending on number of days in each month, we can see that for Emails, Calls and Purchase line plots there is a bit spike in months that have 31 days, a slight drop in months that have 30 days and reasonable drop in February of 2016 and 2017.
For meetings on the other hand there is an upward trend. Need to be noted that some months of meetings were filtered out because they showed values around 0. Starting from October 2015 we might notice increase in the number of meetings.
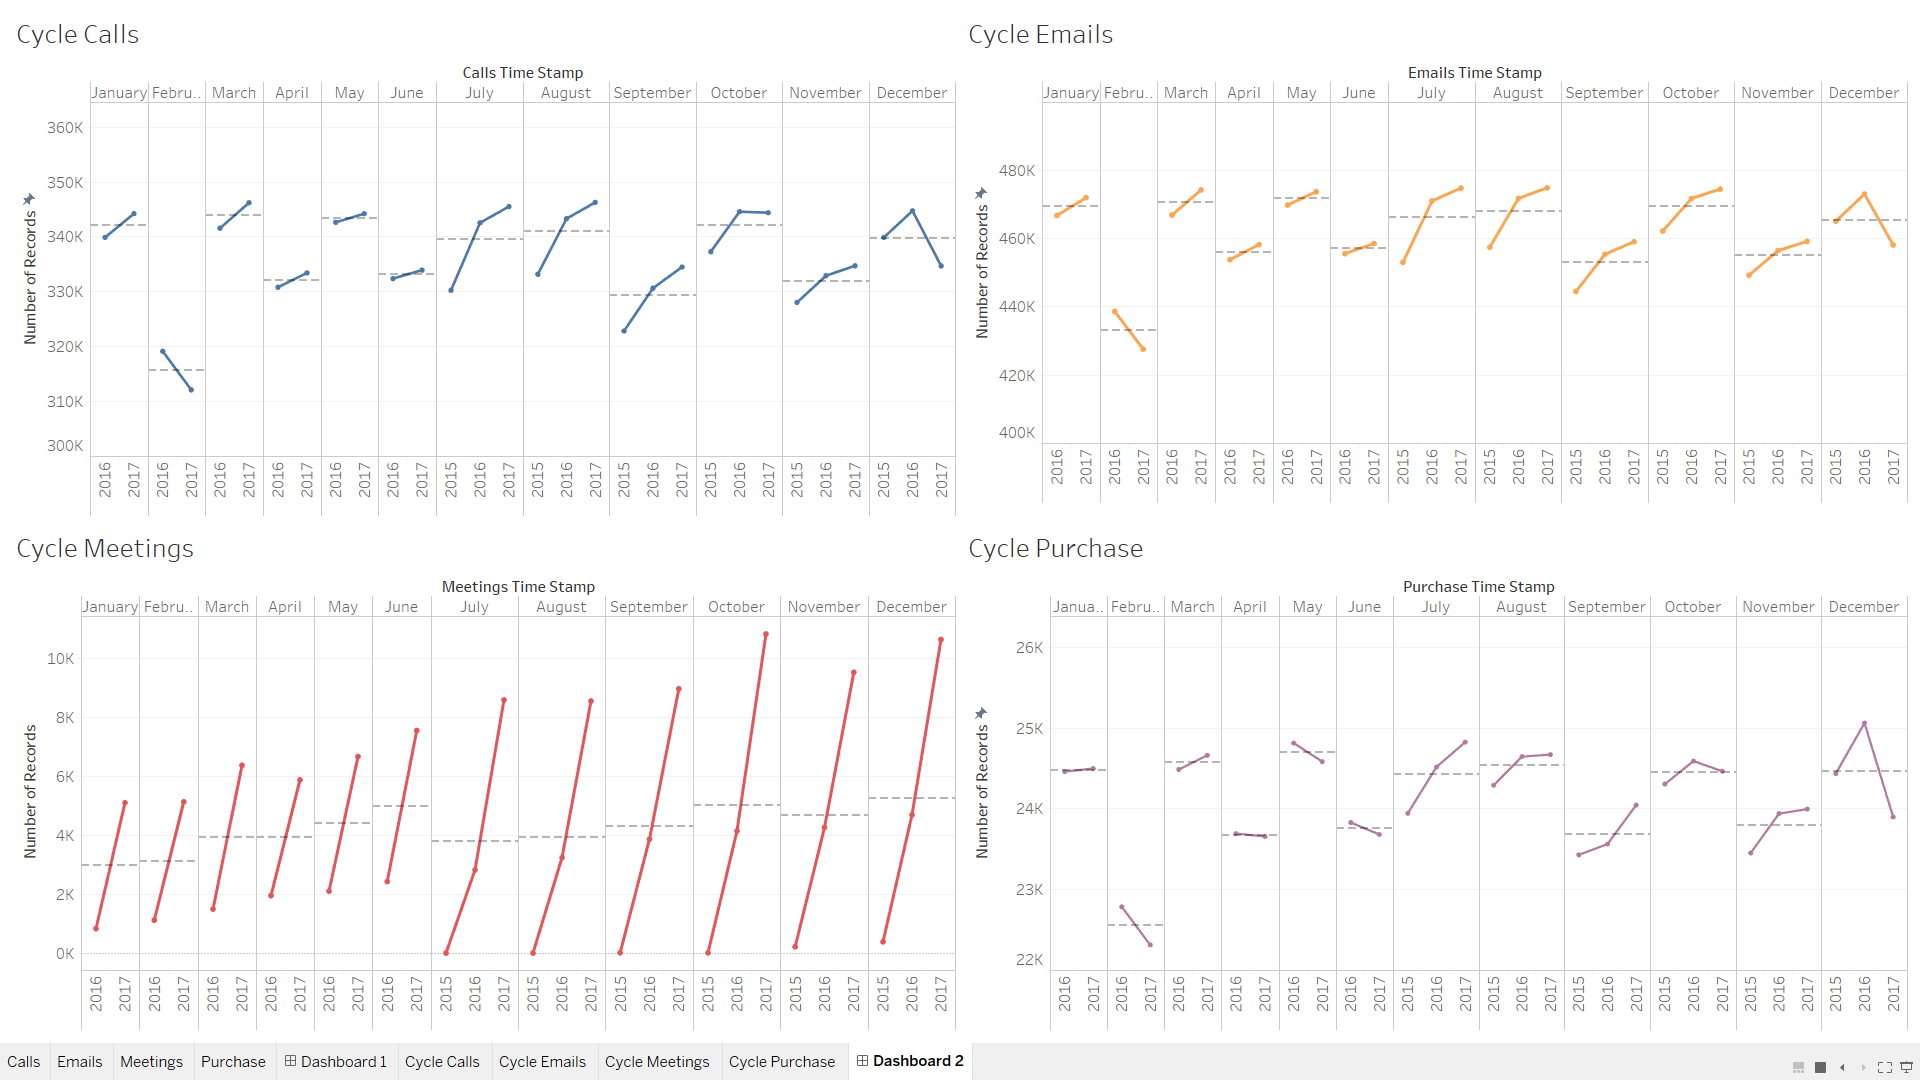
To compare the months in each year I have plotted the cycle plot where we might observe some drops and ups over the 2.5 years.
By looking at this plot we may easily determine which months show drops or increase in the number of calls, emails or purchases relatively to other years. Again here for some months we only have 2016 and 2017 years and drop in February from 2016 to 2017 might be explained by 1 day difference.
Overall for months where we noticed increase it is obvious that increase from 2015 to 2016 relatively higher than increase from 2016 to 2017 which might indicates relatively slow increase in last year. Although for Emails and Calls the trend by months showing almost the same pattern, Purchases on the other hand differs by showing decrease from April to June, in October and December which is below average number for that months. It worth to mention that for December for all communications type there is a drop, however for Purchases it is obvious the percentage of the drop is quite high.
One of the suspicious patterns that we can extract by visualizing all the types of communications in one dashboard the highest months for Meetings happened in October and December 2017 when exactly purchase amount decreased substantially. From the given data we might not say explicitly that the company growing or opposite, most probably the pattern is almost the same over the given period, because the range of the average value for each months of years fluctuate almost in the same interval.
Who else appears to be closely associated with suspicious group?
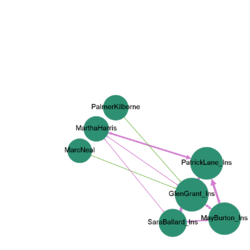
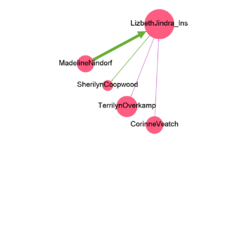
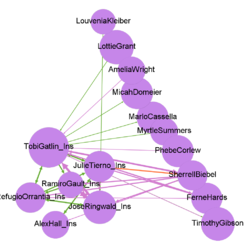
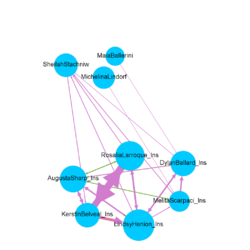
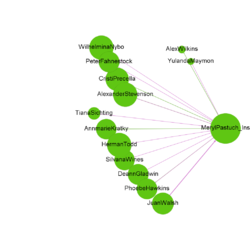
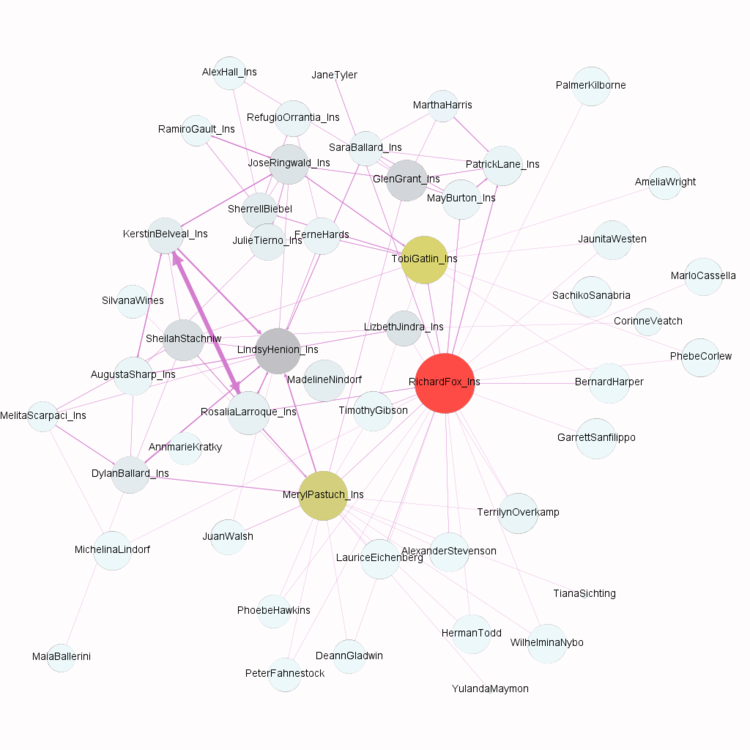
After joining the suspicious data with large data set and running Modularity we have grouped individuals into 6 different communities. Individuals without 'Ins' adding were identified as new suspicious members.Below are shown all the members of the communities:
Which employees are making suspicious purchases?
By Filtering only purchase type we can find out the names of the employees who is making suspicious purchases according to the insider information.
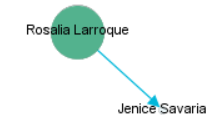
From here we can see that from the suspicious group of employees Rosalia Larroque making purchase from Jenice Savaria.
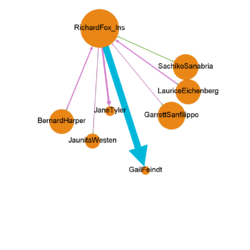
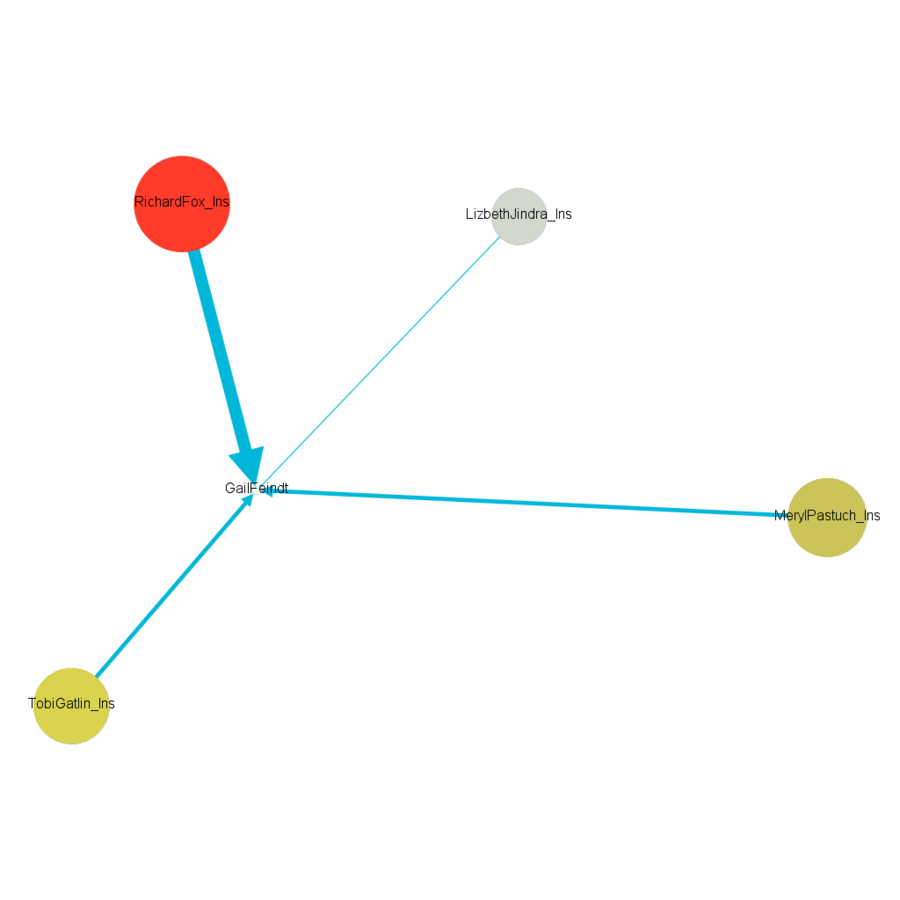
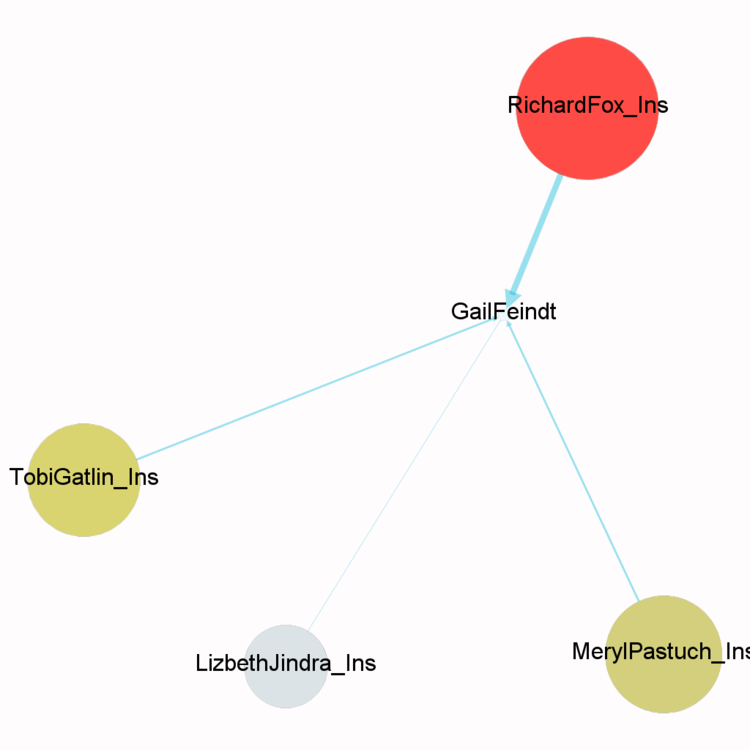
There is only one person - Gail Feindt who made the purchase with four suspicious individuals: Richard Fox, Tobi Gatlin, Meryl Pastuch and Lizbeth Jindra.
Organizational structure and a full picture of communications
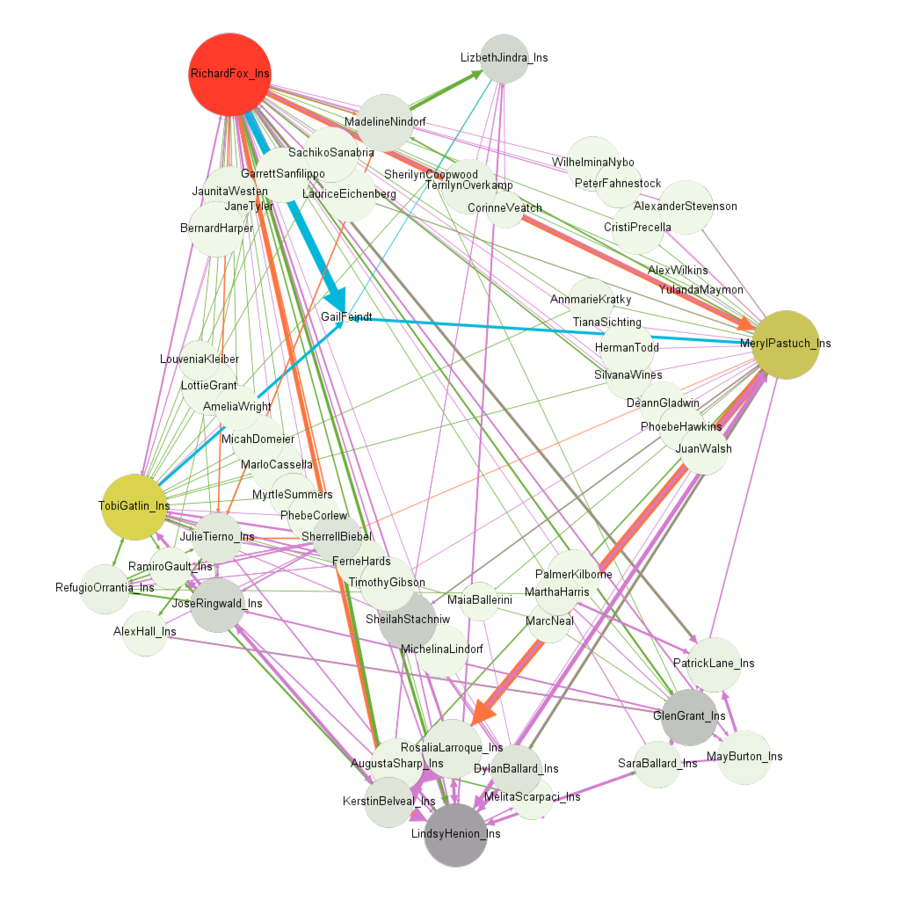
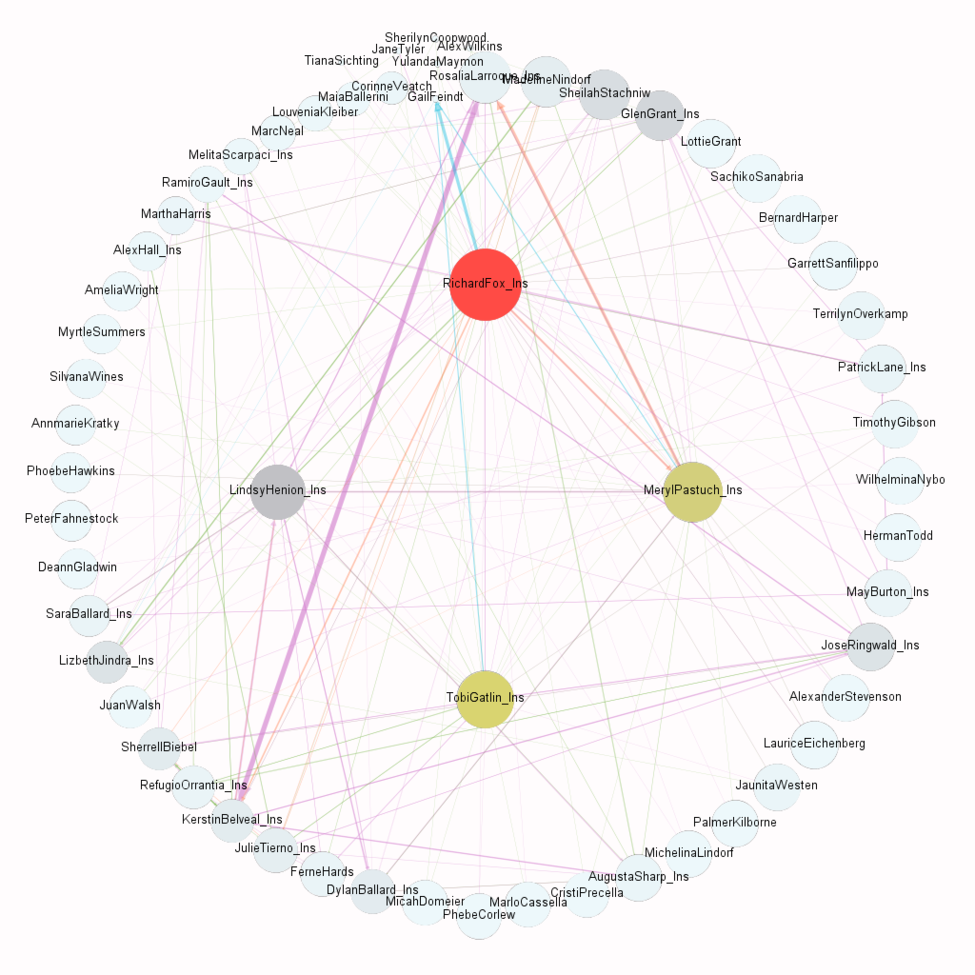
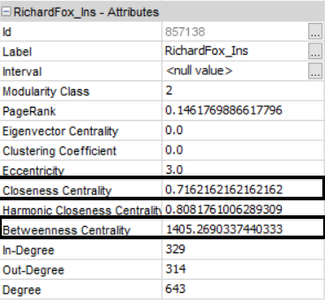
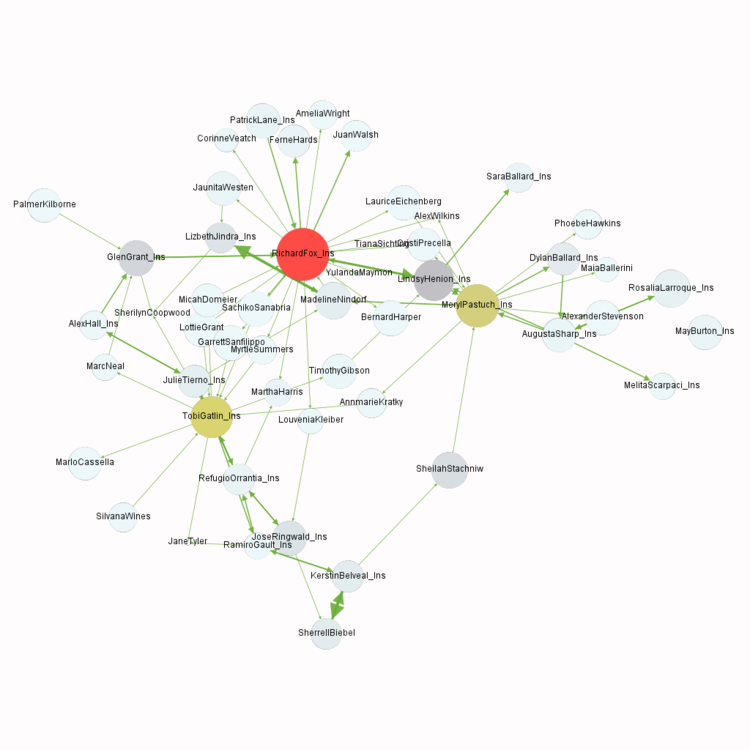
From the above network graph we can identify the organizational structure where Richard Fox has the highest position according to assigned betweenness and centrality.
Some people from our analysis have higher betweenness value, while others have higher closeness values. Therefore, the main leaders in this network are: Richard Fox, Meryl Pastuch, Tobi Gatlin, Lindsy Henion, Glen Grant, Sheilah Stachniw.
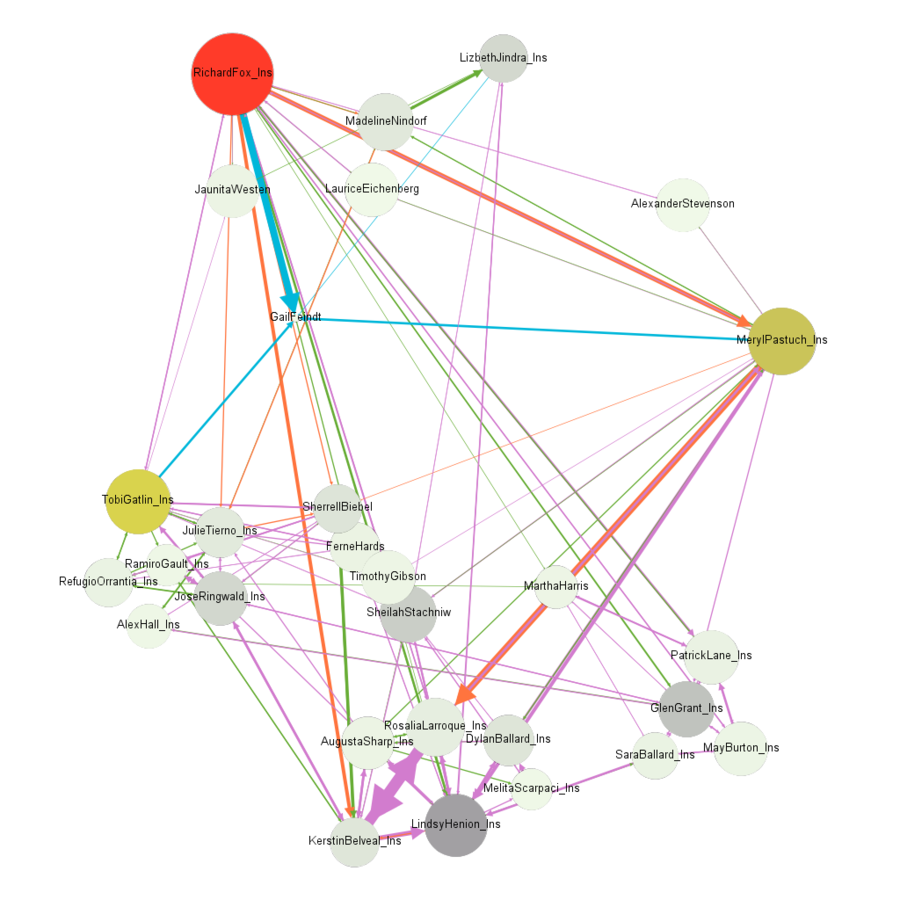
By setting the degree measure at least to 4 we can see clear picture of all interactions within the group.
From above graph we can conclude that mostly people communicate via emails, followed by calls, meetings and making purchases.
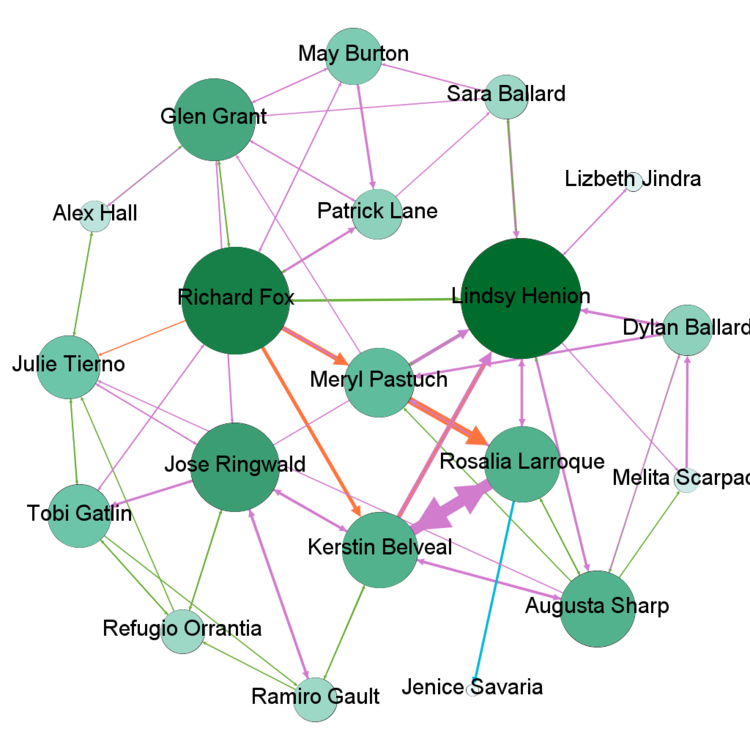
For call interactions (green colour) the thickness of the edges show weight of that connection type between different individuals: Medeline Nindorf -> Lizbeth Jindra, Kerstin Belveal <-> Sherrel Biebel (both sides), Richard Fox -> Lindsy Henion.
For email interactions (purple line): Rosalia Larroque <-> Kerstin Belveal, Kerstin Belveal -> Lindsy Henion, Meryl Pastuch -> Lindsy Henion.
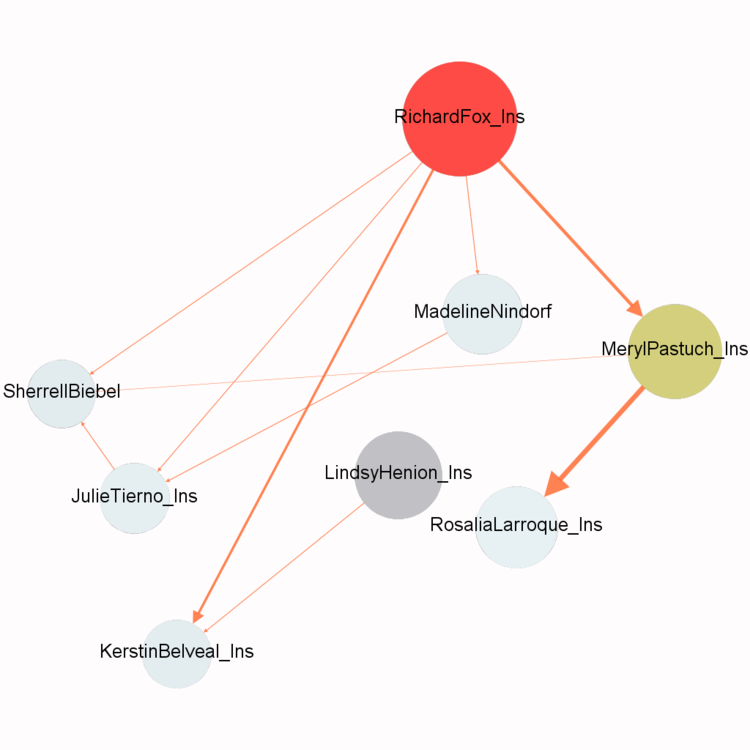
For meetings interaction (orange colour): Meryl Pastuch -> Rosalia Larroque, Richard Fox -> Meryl Pastuch, Richard Fox -> Kerstin Belveal, Madeline Nindorf, Julie Tierno, Sherrel Biebel.
For purchases(blue colour) there is only Geil Feindt from whom Richard Fox, Tobi Gatlin, Meryl Pastuch and Lizbeth Jindra purchase.
Changes in the group composition depending on activities and over time
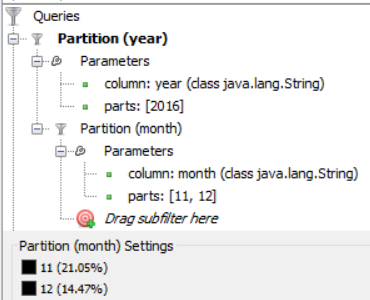
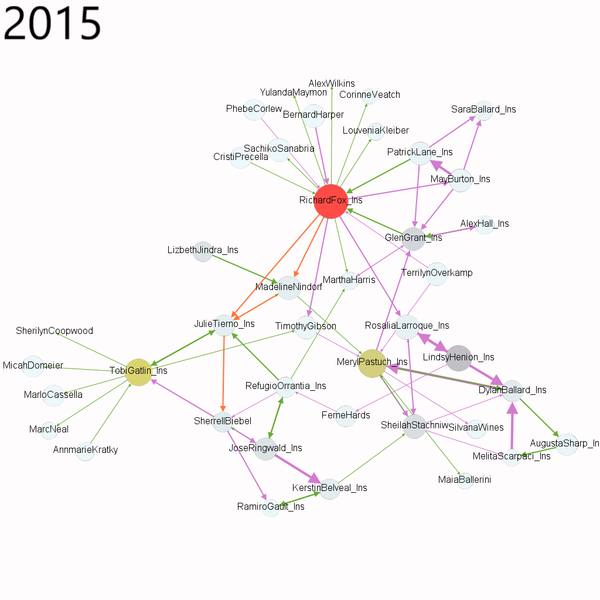
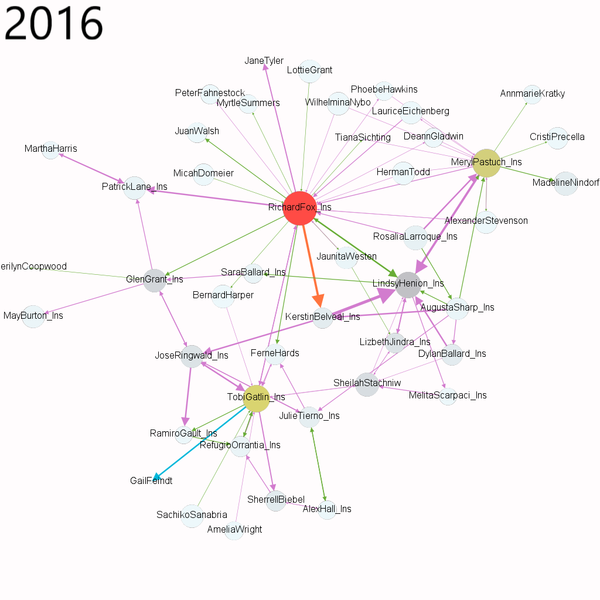
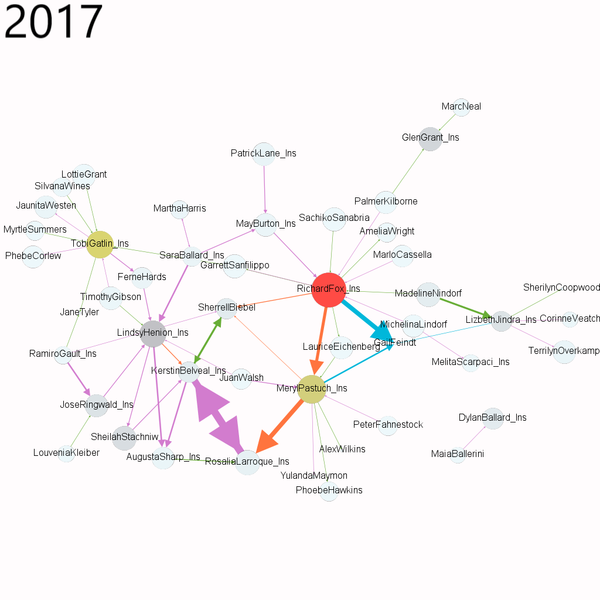
When we filter our the overall connections by year we can see that mostly communications happened in 2016 (40.35%) , followed by 2015 (32.02%) and lastly 2017 (27.63%).
In 2015 there are 41 nodes and 73 edges, whereas in 2016 the number of nodes increased to 45 nodes and 92 edges and mostly communications were experienced in November and December of 2016.
In 2017 even the number of the people interacting increased to 47, however, the intensity of the interaction decreased to 63.
