ISSS608 2017-18 T3 Assign Liu Yuqing Analysis & Insights
|
|
|
|
|
Contents
Visualization Dashboad
Please find the link to dashboard here:https://public.tableau.com/profile/liu.yuqing4353#!/vizhome/LIUYUQING_Mini-Challenge2/LIUYUQING-MiniChallenge2?publish=yes
Methodology
Parameters
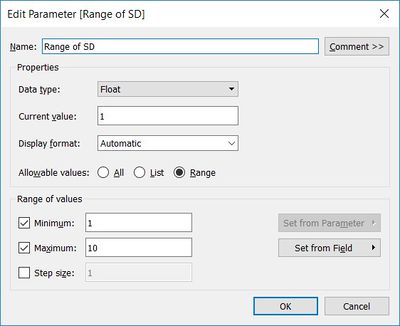
Set range of standard deviation
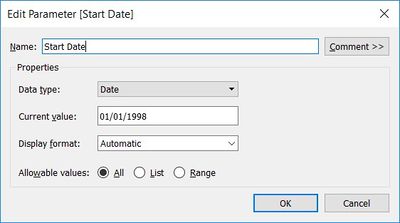
Set start date of visualization to exclude data points not after the day
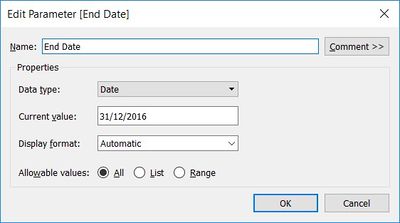
Set end date of visualization to exclude data points not before the day
Creating calculated fields
Create isInRangeDate
Create average value of measures cross window
Create lower value of control interval
Create upper value of control interval
Create outliers to mark datapoints out of control
Visualization analysis
Overview of measures
Trend of each measure
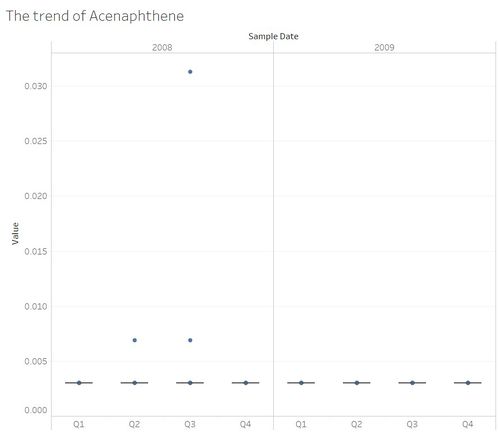
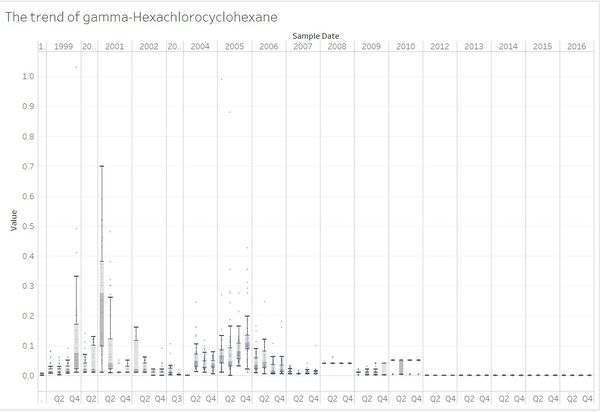
Measured time interval of each chemical is quite different, so first of all, we observed value trend over time of each measure using boxplot.
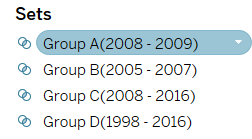
To compare trends of different chemicals over the time, we group measures according to measured time interval regularity. Create set of each group in tableau.
Measure groups
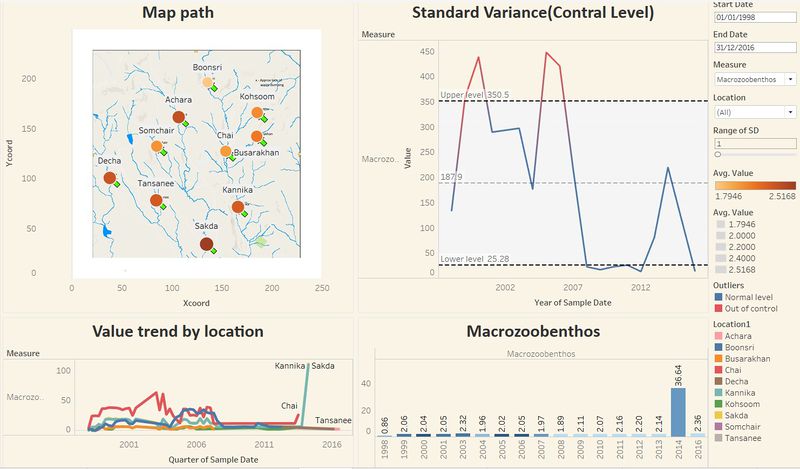
There are 12 chemicals are excluded compare to MCL level, 6 of them belongs to Group A and only 1 chemical in Group D. Perhaps this also shows that the relatively stable material measurement time is relatively short, and the opposite is not a very stable material measurement time span is longer 1.1.2 Pattern of Macrozoobenthos Almost measured units of all chemicals are mg/l or ug/l, there is no unit for .Macrozoobenthos are macro-benthic animals, their life and appearance are relevant with some chemicals and the environment.
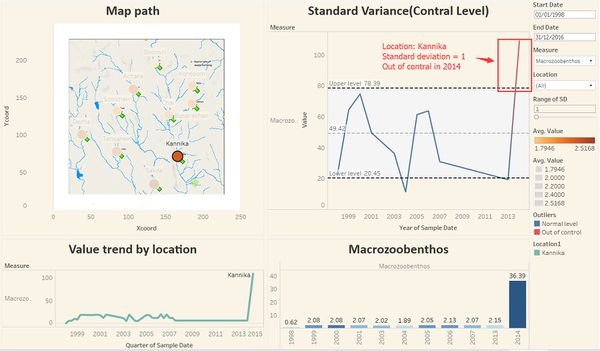
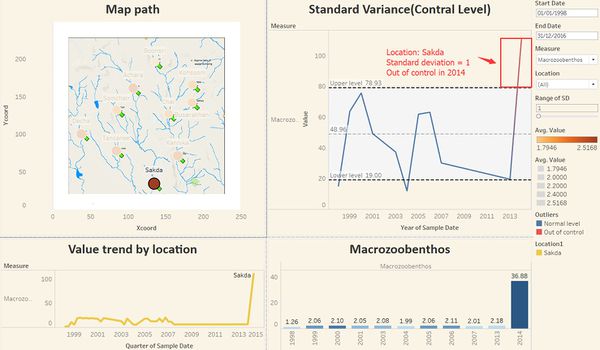
Average value of Macrozoobenthos surged in 2014, this pattern is remarkable in Kannika and Sakda. In this case, we zoom in Kannika and Sakda, observe the standard variance of Macrozoobenthos in the two locations.
Observe same pattern in 2014 in upper stream locations. Upper stream locations of Sakda are Somchair and Achara, upper stream locations of Kannika is Chai.
Analysis by year
2008 – 2009
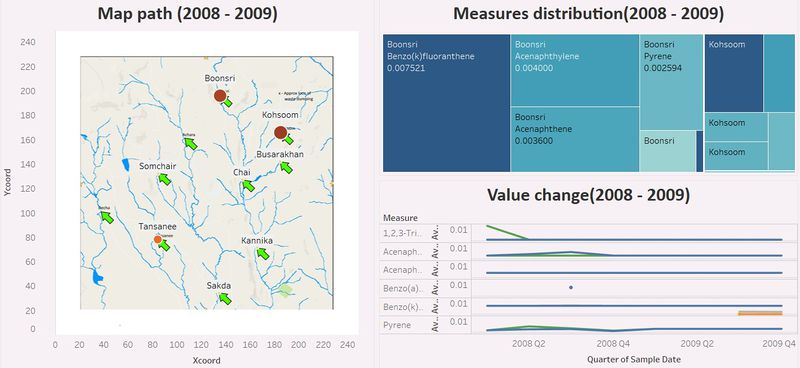
Average value of several chemicals of Boonsri and Kohsoom are higher than the average value of other locations
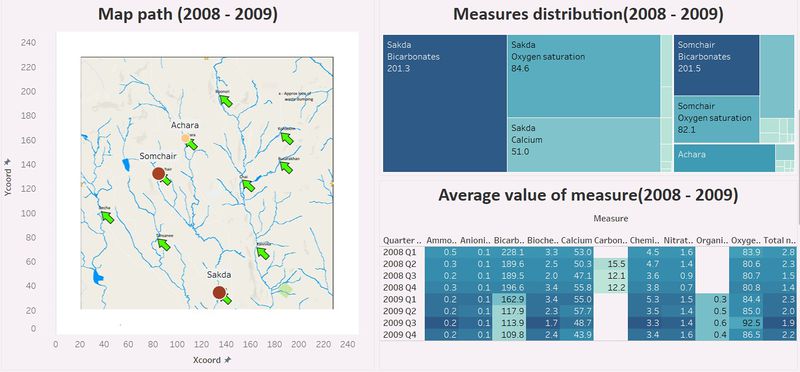
Somchair, Achara and Sakda belong to same main river, we focus on these 3 locations to observe distribution of measures. There are 3 main measures appeared at the 3 locations from 2008 – 2009 – Bicarbonates, Oxygen saturation, Calcium. Value of each measure at Sakda is higher than other two locations.
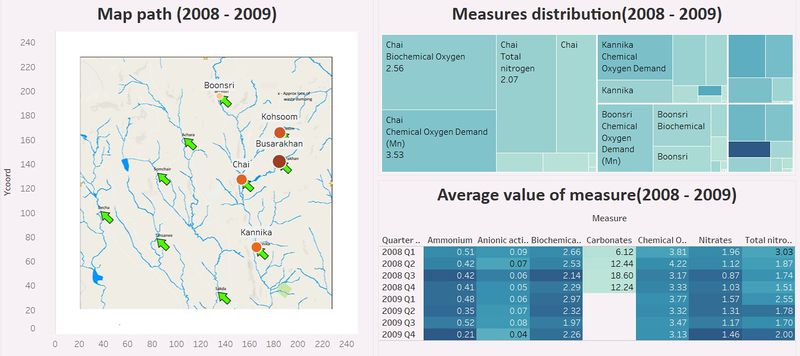
Boonsri, Kohsoom, Busarakhan are upper streams of Chai, Chai is upper stream of Kannika, so we focus on these 5 locations together. Bicarbonates, Oxygen saturation, Calcium are also very high in these locations. For the measure distribution graph, size stands for numbers of records. Based on this graph, we can notice that records of Chia of many measures are more than Boosri and other locations. Besides, measures are concentrate on Biochemical Oxygen, Chemical Oxygen demand and total nitrogen.
2005 – 2007
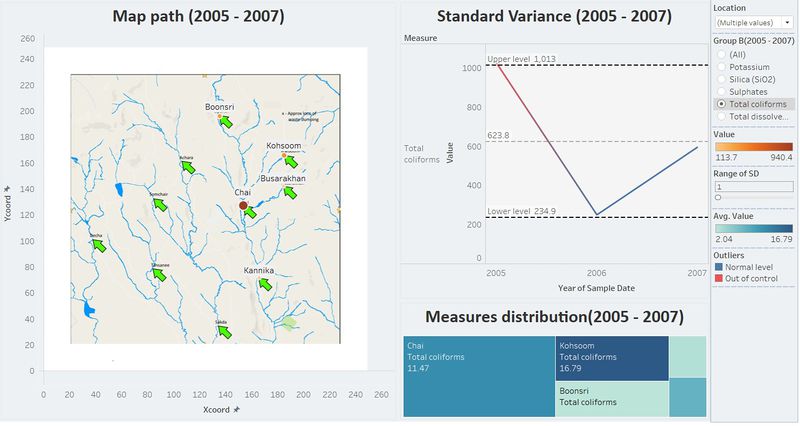
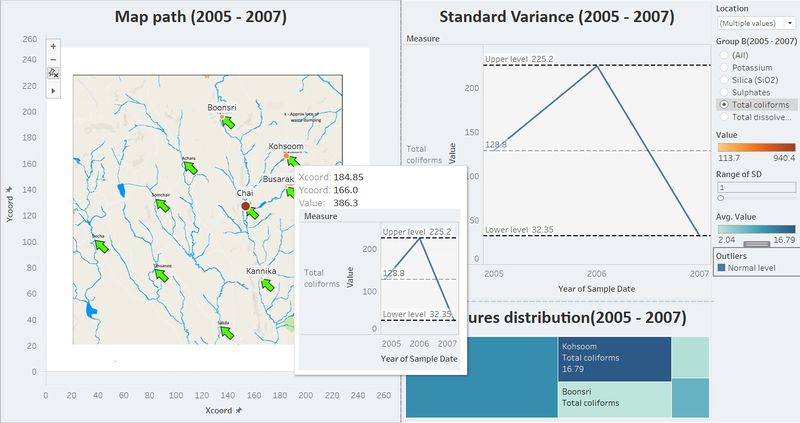
Total coliforms had different trend from other measures – average value decreases from 2005 to 2006 and increases from 2006 to 2007, trends of other measures are opposite.
Trend of total coliforms at Kohsoon is different from Boonsri, Chai, Busarak and Kanika.
2008 – 2016
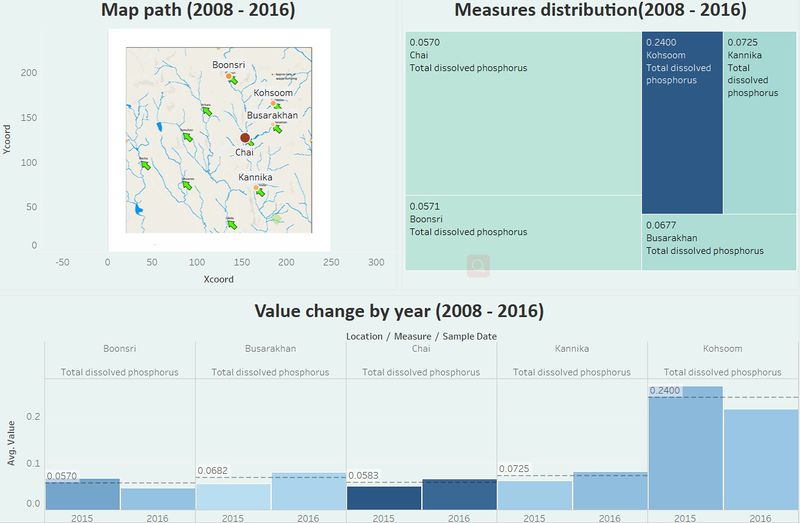
Total dissolved phosphorus only appeared in 2015 and 2016, which average value at Kohsoom is much higher than average value of other locations belong to same main river.
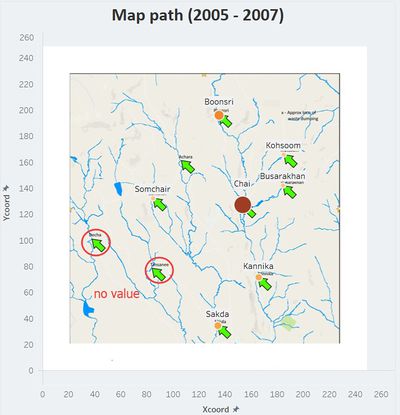
Among the continuously changing measures from 2005 to 2007, there are no measured values in Decha and Tansanee.
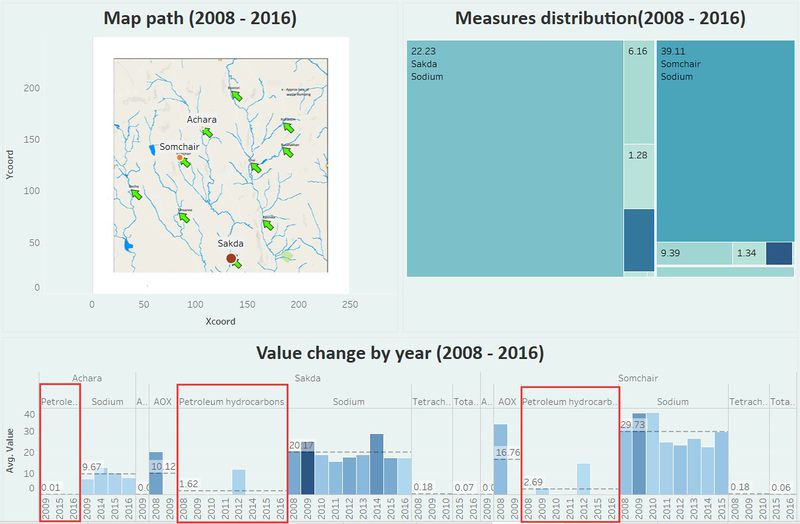
For Sakda, Somchair and Achara streams, trends of Petroleum hydrocarbons are quite abnormal from 2008 to 2016. The most obvious phenomenon is Petroleum hydrocarbons increased significantly in 2012, which maybe caused by sewage of factory around Somchair.
1998 – 2016
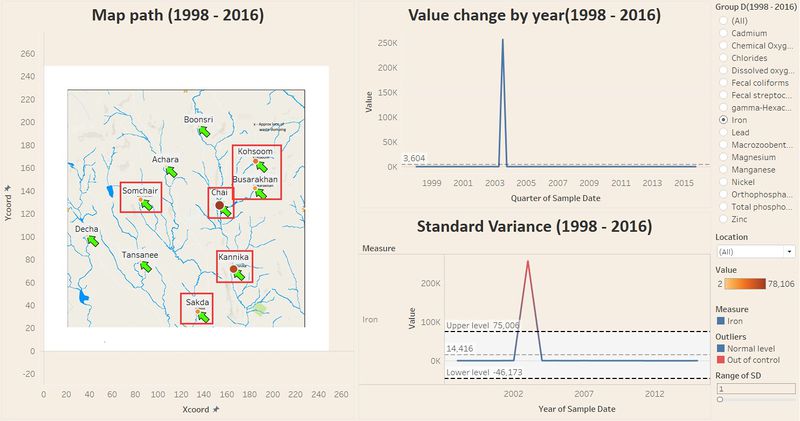
Iron grew significantly in third Quarter, 2003 at all marked locations. For other places, the average value of iron shows a fluctuated trend. Most metal materials have a continuous measurement time over the 18 years from 1998 – 2016.
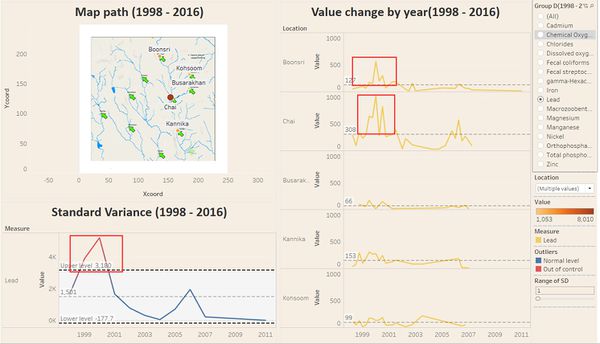
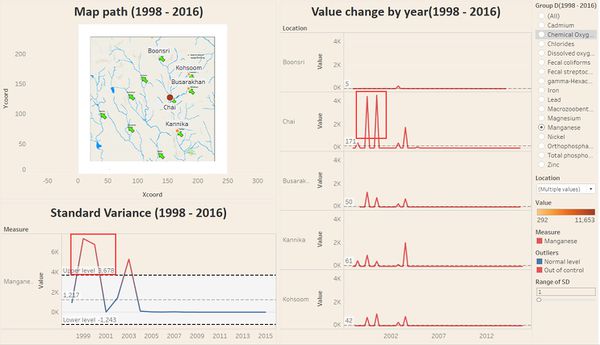
For two metal chemicals, their average values were out of control level from 1998 – 2002. For Lead, Chai and Boonsri the two locations are mainly influenced the trend. For manganese, Chai showed the most obvious influence, followed by Busarakhan, Kannika and Kohsoom.
Conclusions
1. The factory sewage location may be somewhere between Kohsoom and Busarakhan and near Somchair. According to analysis, most chemicals averages are high at Kohsoom, Chai, Sakda and Kannika.
2. Trend of upstream and downstream are quite similar, but different upstreams may have different effects on downstream. For example, Boonsri has more influence than Kohsoom on Chai.
3. The locations of the sewage by factories may be different at different times. Sewage pollution may occurred around 2014 – 2016 near Kohsoom or Busarakhan, however, this should be happened around 2003 – 2004 near Boonsri.

