ZL-Data Preparation
|
|
|
|
|
|
|
In the csv file, “Chemical units of measure”, there is one measure has missing value. Macrozoobenthos is a type of animals, therefore the missing value seem to have no effect on our analysis.
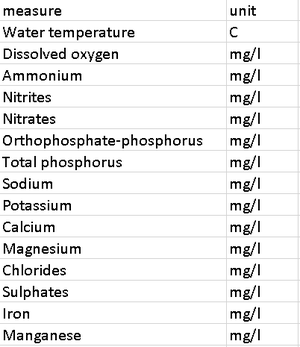
Meanwhile, many units of measures in csv file are “?g/l”, they should be “µg/l”. Therefore, I replace the unit from “?g/l” to “µg/l”. Now the content of “chemical units of measure” file looks like below:
Data Combination
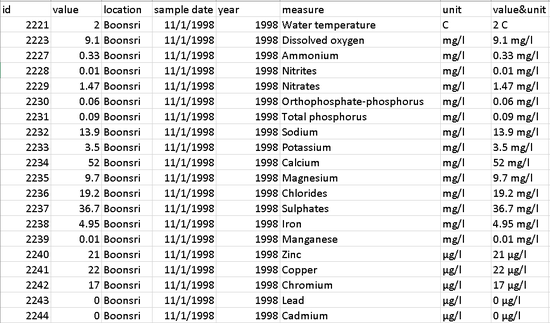
Since the Mini Case 2 has several csv files, to make it easier to do the analysis, I combine these files together, the revised csv file looks like:
Add Location and Map
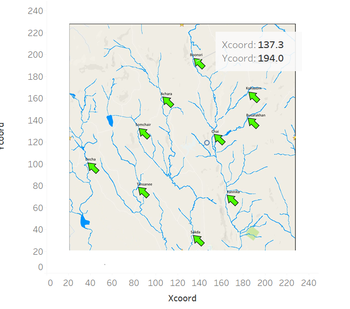
Since there is a waterways Final image, so I can identify the latitude and longitude of each waterway sensor locations. Then I can do the mapping for geographical visualization so that I can combine the analysis result with the waterway map. To generate the geographical visualization,
- Import the waterway final image into the Tableau
- Add an annotate point then check the latitude and longitude of each waterway sensor locations
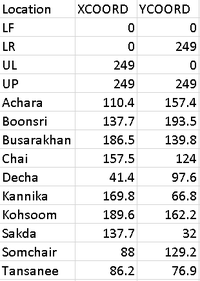
- Create an excel file to record the Xcoord and Ycoord.
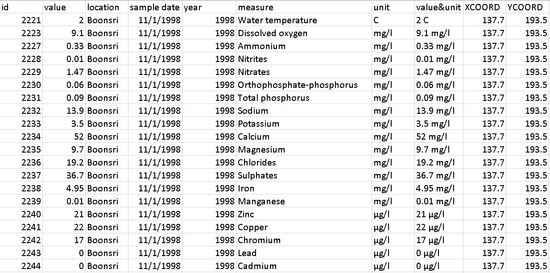
Create a final data resource
I decided to combine the location record with the measure information together to make the analysing much easier. After consolidating, the final version of data source file looks like below:

