From Visual Analytics and Applications
Jump to navigation
Jump to search
VAST Challenge 2018:Mini-Challenge 2: Like a Duck to Water
Tools
Data preparation
- From the chemical units of measure file, we see some chemical units have unrecognizable value, after we check it should be replace in µg/l.

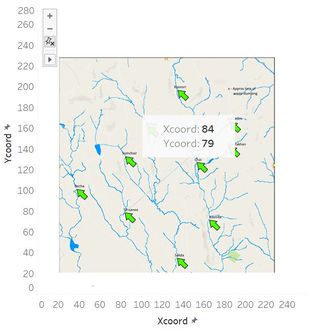
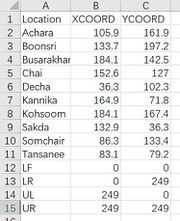
- In order to show geographical visualization, we can use the X-coordinate and Y-coordinate get from the given waterway picture, use the annotate point function from Tableau to get the data of these 10 locations.


|