Group2 Proposal

From Visual Analytics and Applications
Revision as of 12:24, 9 August 2018 by Priyankas.2017 (talk | contribs)
Jump to navigation Jump to search
Group2 banner.jpg

World Energy Production & Consumption: A Visual Study

Overview

Proposal

Analysis Report

Poster

Application


Project Overview

Properly functioning markets for electricity, natural gas, oil and pollution allowances are essential for the rational allocation of resources and cost-effective attainment of environmental goals. Rapidly changing energy dynamics determine the course of our economic development, geopolitics, technological breakthroughs, massive investments and trade flows.With renewable energy moving from niche to mainstream, the fuel mix is shifting.

The intent of our project is to visually explore the world in transformation as the global energy system is undergoing major shifts. By using interactive visualization techniques, we propose to aid discovery of long run transitions and short run adjustments by analyzing key factors like production and consumption of various energy resources-both renewable and non-renewable, electricity generation using these resources and the effects of energy usage in terms of Carbon Dioxide emissions.

About The Data Source

BP plc, formerly British Petroleum, is a British multinational oil and gas company headquartered in London, England. It is the world's sixth-largest oil and gas company, the sixth-largest energy company by market capitalization and the company with the world's twelfth-largest revenue (turnover). It is a vertically integrated company operating in all areas of the oil and gas industry, including exploration and production, refining, distribution and marketing, petrochemicals, power generation and trading. It also has renewable energy interests in biofuels and wind power.

For 66 years, the BP Statistical Review of World Energy has provided high-quality objective and globally consistent data on world energy markets. The review is one of the most widely respected and authoritative publications in the field of energy economics, used for reference by the media, academia, world governments and energy companies. A new edition is published every June.

For the purpose of this project, we are using the BP Statistical Review of World Energy data.

Critique of the Existing Visualizations

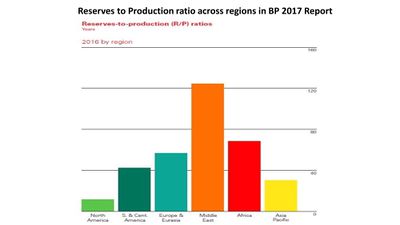
We noticed that all the existing visualizations in the BP Statistical Review report are static in nature which limits the usage of the plots and restricts information retrieval. Below image shows a sample visualization from the report:

Group2 critique viz2.JPG


As shown above, the visualization does not allow user to dig deeper into the dataset. Hence, to enhance usability of the the data, we have come up with interactive plots in order to gain deeper insights.

Challenges

Project Scope: The data set we've picked up has information on different types of energies across countries since 1965. This information can be used in a number of different ways and hence we need to narrow down the scope of our project to focus on our objective.

Data Preparation: The data is present in a single excel workbook containing over 60 tabs and cannot be used as-is. Significant data cleaning and preparation needs to be done in order to make the information usable for the project

Data Visualization: The BP Statistical Review is a benchmark and creating innovative interactive dashboard to improvise the same is an interesting challenge