From Visual Analytics and Applications
Jump to navigation
Jump to search
|
|
| Line 171: |
Line 171: |
| | </td> | | </td> |
| | <td>[[File:YzcQ4-1.png|600px]]</td> | | <td>[[File:YzcQ4-1.png|600px]]</td> |
| | + | </tr> |
| | + | <tr> |
| | + | <td><b> 2. Are there any other suspicious purchases?(2) </b> |
| | + | <br>The transaction between ''TrevorWebb'' and ''TyreeBarrenenhe'' is similar with the first group which insider provided. |
| | + | </td> |
| | + | <td>[[File:YzcQ4-2.png|600px]]</td> |
| | </tr> | | </tr> |
Latest revision as of 02:11, 9 July 2018
 VAST Challenge 2018:Secrets of Kasios

Viz & Insights
part1
| Insights |
Visualization |
| 1. Overview the development of company
It's easy to find that the company is growing since 2015,but the increasing rate is not obviously. When it comes to purchases, the number of 2016 and 2017 is similar.Although the increasing rate of emails and calls from 2016 to 2017 is quite low, the number of meeting growing fast over the time. It seems that the management philosophy is changed.
|
|
| 2. Overview the development of company(2)
There are no meetings in few dates of 2015. The data set only contains the information after 2015-05. The number of purchases show us a increasing trend in general.
|
|
| 3. Overview the development of company(3)
The number of calls, emails and purchases is quite stable. Although the changing of purchases shows us a little decreasing, the development of company is increasing in general. Because the changing of meeting has strong influence. It should be easy for the employee who work for Kasios to find that there are more and more meetings from 2016 to 2017.
|
|
| 4. Overview the development of company(4)
Is't is to find that dramatically increasing at first. The phenomenon might be caused by the incomplete data in 2015-05 or something I don't know happen.
|
|
Part2
| Insights |
Visualization |
| 1. Explore the company
The node of first network graph is node.csv and the edge is egde.csv. Layout YIFAN HUwas selected. The color represents different attributes.
Green:calls
Orange:Purchases
Blue:Meetings
purple:emails
It's quite clear that there are some clusters in the graph.
|
|
| 2. Explore the company(2)
To locate the suspicious in the larger group,I set node.csv as node which represent all people who used to communicate with suspicious from 2015 to 2017. On the other hand, I regard sus.csv as edge,which represent suspicious file provided by insider. It's easy to find out where the suspicious are. Although the file didn't tell us any details about the employee. I can speculate what status they are according to the number of emails,calls,meetings and purchases the employ is recorded. For example, those who received most emails in a year should be a management.
Layout Fruchterman Reingoldwas selected.
|
|
| 3. Explore the company(3)
Bigger size of points indicate how important they are in the suspicious group. It's easy to find out that Linds and Richa might be the important guys in the group. Furthermore, it's quite interesting to find that there are some outliers in the network. They are far from the central and the size of the point is quite small. It means that they only communicate with suspicious few time.
|
|
| 4. Explore the company(4)
Pay attention to the suspicious purchases. There are only one record provided by insider. The transaction is made by JeniceSavaria and RosaliaLarroque.It's interesting to find that no one else used to communicate with Jenice except Rosal. On the other hand, Rosal and Kerstin have close relationship.The transaction is happen on 2017-09-20.
|
|
| 5. Explore the company(5)
Most records are recorded in 2015-11. It seems that something suspicious happen during the period.
|
|
Part3
| Insights |
Visualization |
| 2. Explore the suspicious group(2)
2 :purchase.
3 :meetings.
1 :emails.
4 :calls
|
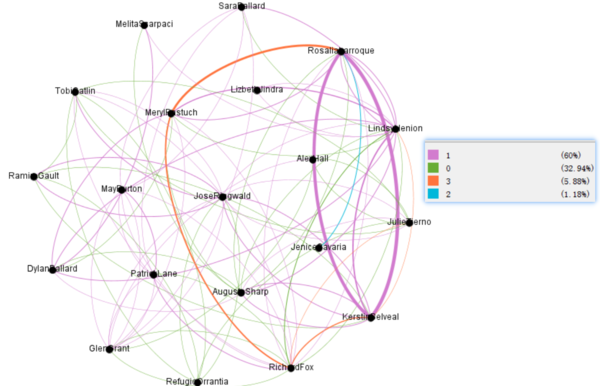 |
The communication structure of the company is shown above.
Part4
| Insights |
Visualization |
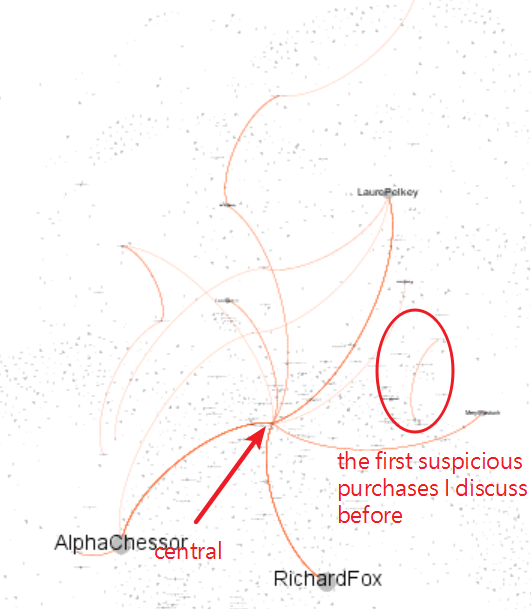
| 1. Are there any other suspicious purchases?
The insider has provided a list of purchases that might indicate illicit activity elsewhere in the company.After adding the other_suspicious_purchases.csv to our data set, I might find any other instances of suspicious activities in the company. The suspicious activities must follow similar rule.
|
 |
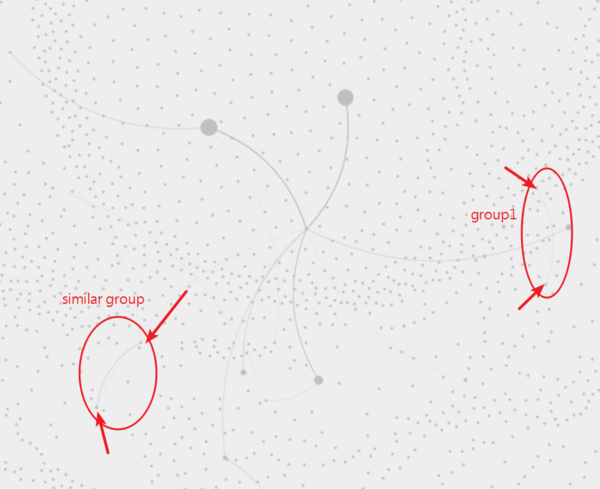
| 2. Are there any other suspicious purchases?(2)
The transaction between TrevorWebb and TyreeBarrenenhe is similar with the first group which insider provided.
|
 |
 VAST Challenge 2018:Secrets of Kasios


