Difference between revisions of "ISSS608 2018-19 T3 Assign SAMEER PANDA Visualizations"
Sameerp.2017 (talk | contribs) |
Sameerp.2017 (talk | contribs) |
||
| Line 153: | Line 153: | ||
==<font size = 3.5><span style="font-family:Verdana;">Data sufficiency</span></font>== | ==<font size = 3.5><span style="font-family:Verdana;">Data sufficiency</span></font>== | ||
| − | # <font size = 3.5><span style="font-family:Verdana;">Many measures have incomplete readings.</span></font> | + | # <font size = 3.5><span style="font-family:Verdana;">Many measures have incomplete readings.</span></font>[[Image:samtrend3.jpg|center|800px]][[Image:samtrend4.jpg|center|800px]] |
| − | [[Image:samtrend3.jpg|center|800px]] | ||
| − | [[Image:samtrend4.jpg|center|800px]] | ||
# <font size = 3.5><span style="font-family:Verdana;">Sporadic readings taken across measures.</span></font> | # <font size = 3.5><span style="font-family:Verdana;">Sporadic readings taken across measures.</span></font> | ||
# <font size = 3.5><span style="font-family:Verdana;">Cadmium uptake from water by aquatic organisms is extremely variable and depends on the species and various environmental conditions, such as water hardness (notably the calcium ion and zinc concentration), salinity, temperature, pH, and organic matter content, none of which is mentioned in the data.</span></font> | # <font size = 3.5><span style="font-family:Verdana;">Cadmium uptake from water by aquatic organisms is extremely variable and depends on the species and various environmental conditions, such as water hardness (notably the calcium ion and zinc concentration), salinity, temperature, pH, and organic matter content, none of which is mentioned in the data.</span></font> | ||
Latest revision as of 01:00, 9 July 2018
 VAST Challenge 2018: Like a Duck to Water
|
|
|
|
|
|
|
Insights |
The industries are perceptibly at risk from the growing concerns with water safety. Companies using chemicals, especially suspected heavy metals in large quantity, will likely be under greater scrutiny for many more years due to the accumulation of concurrent water contamination events. Companies that use any chemical, whether or not the chemical has been proven to be a definitive hazard to human health when ingested in drinking water, seem to be at risk under this trend for being held responsible for ailments in the nearby communities. Many government agencies that regulate water safety may become stricter on industry that either discharge metals into water sources or perform activities that could discharge toxic and regulated substances to state waters years into the future. Let us examine the trends from the dataset we have on Boonsong Lekagul Wildlife Preserve.

To view the link of the Insights in Tableau Public, click here
Contents
Q1
Trends on chemical contamination - Categorized by Date, place & reading frequency

Ammonia trends

- Date
- Average value has lowered by a factor of 3, from 1998 to 2016.
- Value increased to dangerous levels during 2000,2003,2006 and 2014.
- Between 2002-2009, periods between January-February & October-November had high levels of average values.
- January 2010, January 2014 and October 2014 had high readings nearing 1.0 mg/L, 5 times more than permissible limits.
- Place
- Two places, kohsoom and Tansanee have higher readings than other places.
- Tansanee has reading for ammonia starting only from 2009, and had the highest average reading on 2014.
- Readings
- Ammonia is one among the group of most readings taken among all chemicals, 3.5%.
- Readings taken closer to average number of readings were between 2002 to 2009.
- 2010 onwards, more than 300 readings were taken for the first time.
Biochemical Oxygen trends

- Date
- Between April to August 1998, biochemical oxy exceeded the dangerous levels of 8 mg/L twice out of three spikes in measurement.
- Three times in a space of 4 years, the readings spiked to above 5mg/L, before stabilizing after December 2002.
- Every year since 2003, the readings spiked between January-March above the average mark.
- Place
- Kohsoom is one of the venues where readings were taken from 1998 to 2016.
- Kohsoom had an abnormally high reading of 8 and 4 times the permissible limit during August 1998 and October 2002 respectively.
- Readings for Tansanee were available from 2009, during which the average readings exceeded the dangerous levels many times, having a peak of 5 times the dangerous levels on February 2016.
- Readings
- Bio Oxy is eighth in the most readings taken parameter, comprising of 3.3% of total.
- Between 2002 and 2013, consistency is maintained closer to average number of readings.
- Before 2002, less than average readings were taken.
Cadmium trends

- Date
- Recent readings of Cadmium levels have been below 0.5 μg/L.
- Two readings of above 8μg/L were 6 years apart, between May 2001 to 2007.
- The average readings of Cadmium were very low from the dangerous levels between 1999-2008.
- Place
- Between 1998 and 2009, 5 places had readings more than permissible levels of cadmium.
- Kohsoom had a very high reading of 45.6 μg/L on June 1998 and once in July 2001 above 17 μg/L.
- Boonsri had three readings above the dangerous levels on 1999, 2005 and 2007.
- Busarakhan had two readings much higher than permissible limits between 1999-2000, but has stabilized since.
- Only Somchair after having stable readings in the past, had a single reading of more than twice the dangerous levels in April 2009.
- Readings
- Cadmium readings were for over 2.2% of total readings.
- There are over 500 near zero values out of 2963 readings of cadmium.
- Recent cadmium readings have been lower than average number of readings taken over the years.
- Period between March 2002 and December 2007 had more consistent readings.
Chloride trends

- Date
- Chloride readings had reached a peak of over 100mg/L in October 2005 and December 2013.
- Recently, between September 2014 and December 2016, many of the average readings have crossed the total average readings taken over the years.
- Overall, the average reading values of chloride has remained stable.
- Place
- Sakda has seen average readings of over 100mg/L six times since September 2002. Half of those readings were seen since December 2013, starting with an average reading of 468mg/L.
- Tansanee had high readings ever since it was first taken from January 2009. Readings have remained on a higher side since January 2014.
- Readings
- Chloride is among the top 10 salts having readings of over 2.8% in total.
- Less than average readings were taken until February 2002.
- More consistant readings were taken after November 2009.
Chromium trends

- Date
- Chromium readings were very high between April 1998 to August 2003.
- The readings were much stable between January 2004 to September 2012.
- There has been a decline in the Chromium average values from May 2013 to December 2016.
- Place
- Sakda had an average reading of 147μg/L during April 1998, resulting in the elevated overall average.
- Kohsoom did not have any readings taken between December 2007 and January 2010.
- From January 1999, Kohsoom had very high chromium readings until August 2003.
- Readings
- Among the readings taken across all categories, Chromium has the highest readings among heavy metals at 2.2%.
- On short periods between 2001-2002 and 2003, the number of readings taken had dropped. Sporadic readings were taken between the period of 2007 and 2010.
- Since March 2012, consistently less readings were taken with the exception of September 2014.
Copper trends

- Date
- Copper readings were consistently higher than average in the periods between April 1998 to March 2009.
- The average readings had reached dangerous levels on May 2000, February 2002 and August 2003.
- Since April 2009, the readings were lower than average except for 6 instances between February 2011 and May 2016.
- Place
- Kohsoom had an average reading of 564 μg/L on August 2003, more than 25 times the total average readings.
- Kohsoom and Somchair had more readings of dangroeus levels of copper than any other place.
- Readings
- Copper is among a high percentage of heavy metals found in the waterways at 2.2%.
- The readings taken for Chromium, copper and other heavy metals are almost identical.
Dissolved Oxygen trends

- Dissolved Oxygen readings differ with the seasons.
Q2
Anomalies/Outliers
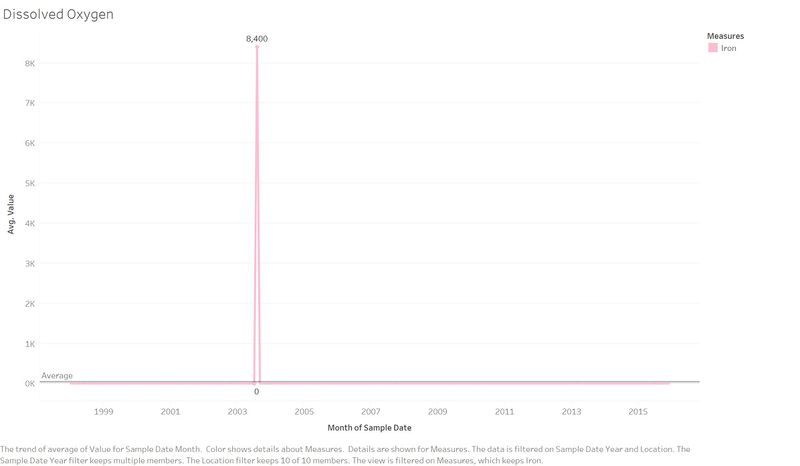
- Iron has abnormal readings August 2003, not consistent with any other readings.
- Ammonium reading do not specify units with respect to N,NH3,NH4 or Dissolved Oxygen.
- Arsenic has a reading of 17.138 μg/L during August 2015, which clearly is an outlier.
- Bio Oxy has a reading in excess of 50 mg/L twice in 1998 and twice in next 18 years.
- Sample size taken for Boron is not enough to derive any trends.
- Dissolved Oxygen readings fluctuated with seasons.
Effects
- Iron outlier. With maximum values closer to 0, this reading does not make sense.
- Ammonia readings have no reference point.
- Arsenic readings increase the average readings for the month of August in 2015 along with increasing the metric for the year.
- Bio Oxy readings affect the average readings taken over the years.
- Dissolved Oxygen metric is not effective in determining water pollution.

Data sufficiency
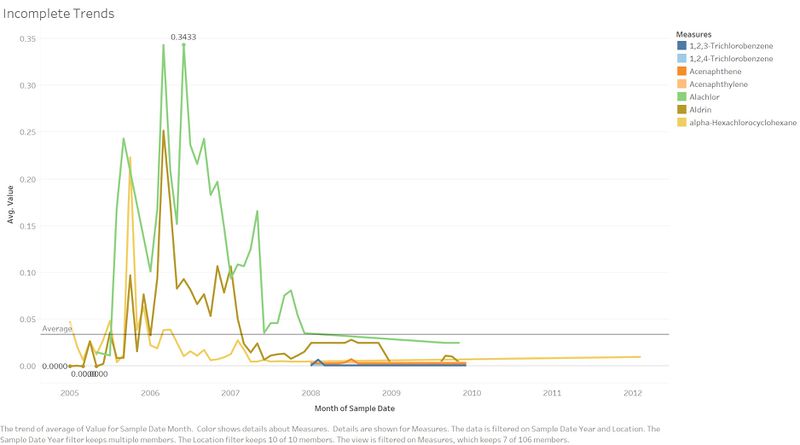
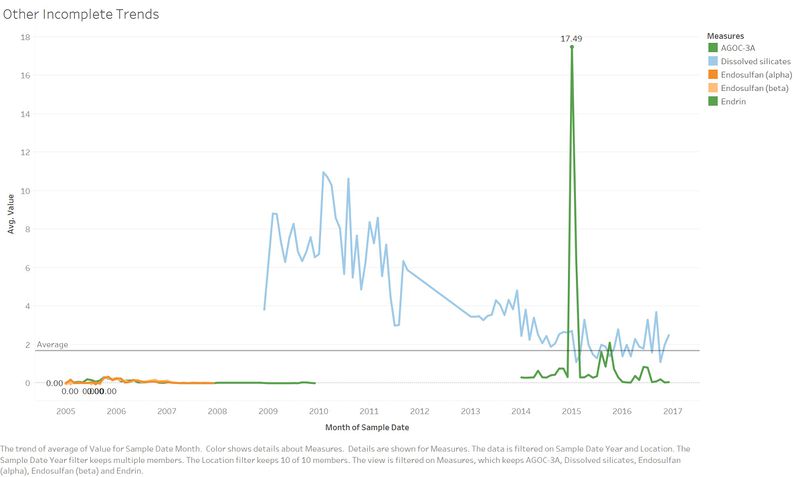
- Many measures have incomplete readings.
- Sporadic readings taken across measures.
- Cadmium uptake from water by aquatic organisms is extremely variable and depends on the species and various environmental conditions, such as water hardness (notably the calcium ion and zinc concentration), salinity, temperature, pH, and organic matter content, none of which is mentioned in the data.
- Duplicate readings taken on same day.
- No uniformity in taking of the readings. Each contaminant has to be tracked over a fixed period of time.


Changes to sampling approach
- Readings to be taken at uniform period of time.
- While recording outlier values, must be analyzed more than once.
- Comparison of pattern of historical readings must be done during sample collection.
Q3
Marine life
- Different species of fish can tolerate different levels of ammonia but in any event, less is better.
- Biochemical Oxygen levels indicate the concentration of chemicals capable of suppressing microbiological growth or activity.
- Cadmium is toxic to a wide range of micro-organisms. However, the presence of sediment, high concentrations of dissolved salts or organic matter all reduce the toxic impact. The main effect is on growth and replication.
- The ratio between chemical oxygen demand and biochemical oxygen demand can be used in some contexts as a measure of whether the water contains toxic substances.
- Radiological contaminants are dangerous for marine life.
Other wildlife
- Animals and birds drinking the river water would be affected.