Difference between revisions of "ISSS608 2017-18 T3 Assign MENG XIANGYI Data Preparation"
Jump to navigation
Jump to search
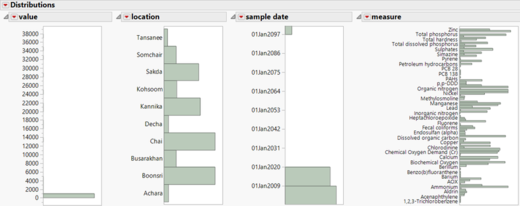
For our analysis, Value, Location, Sample Date, and Measure have been identified as our concern, so we do some data exploration about them.
Xymeng.2017 (talk | contribs) |
Xymeng.2017 (talk | contribs) |
||
| Line 1: | Line 1: | ||
<div style=background:#F6CECE border:#A3BFB1> | <div style=background:#F6CECE border:#A3BFB1> | ||
| + | [[Image:111.JPG|400px]] | ||
<b><font size = 6; color="#8B4513"> VAST Challenge 2018:Mini-Challenge 2: Like a Duck to Water </font></b> | <b><font size = 6; color="#8B4513"> VAST Challenge 2018:Mini-Challenge 2: Like a Duck to Water </font></b> | ||
</div> | </div> | ||
Latest revision as of 23:13, 8 July 2018
|
|
|
|
|
Data preparation
- From the chemical units of measure file, we see some chemical units have unrecognizable value, after we check it should be replace in µg/l.
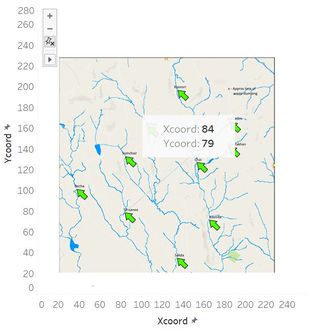
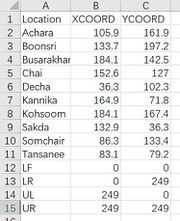
- In order to show geographical visualization, we can use the X-coordinate and Y-coordinate get from the given waterway picture, use the annotate point function from Tableau to get the data of these 10 locations.
Then from the data source page of tableau, join these three files together refer to the picture below. Sheet1 is the location coordinates table.
Data Exploration
- The variable Value in this dataset is the measured value for the chemical or property in this record. We see that values are represented on different scales according to the 'Unit' so it Range from 0 to 37959.28 with a mean of 24.02. it is not easy to do normalization or transformation, but it will be a problem when doing analysis.
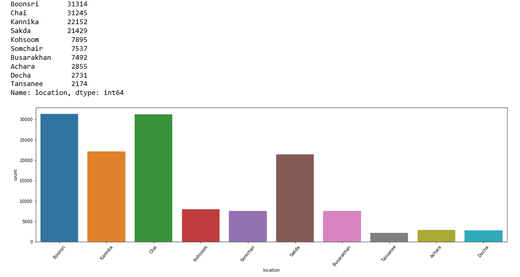
- The variable Location is the name of the location sample was take from, for these 10 locations, from the figure below we can see the total number of readings collected at each location, it indicates a lack of consistency in collection of the chemical samples of different locations.
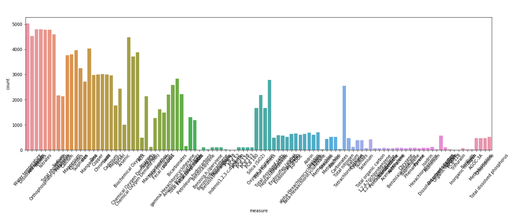
- From the figure below, we can see the distribution of measure. We can see that Measures contain two main part, the chemicals and water temperature. and the Macrooobethos record, so we can divide them into 3 groups for further analysis.
