Difference between revisions of "ISSS608 2017-18 T3 Assign MENG XIANGYI Conclusion"
Jump to navigation
Jump to search
Xymeng.2017 (talk | contribs) (Created page with " <div style=background:#F6CECE border:#A3BFB1> <b><font size = 6; color="#8B4513"> VAST Challenge 2018:Mini-Challenge 2: Like a Duck to Water </font></b> </div> <!--MAIN HEADE...") |
Xymeng.2017 (talk | contribs) |
||
| Line 1: | Line 1: | ||
<div style=background:#F6CECE border:#A3BFB1> | <div style=background:#F6CECE border:#A3BFB1> | ||
| + | [[Image:111.JPG|400px]] | ||
<b><font size = 6; color="#8B4513"> VAST Challenge 2018:Mini-Challenge 2: Like a Duck to Water </font></b> | <b><font size = 6; color="#8B4513"> VAST Challenge 2018:Mini-Challenge 2: Like a Duck to Water </font></b> | ||
</div> | </div> | ||
Latest revision as of 23:11, 8 July 2018
|
|
|
|
|
Answer of Question
Question 1
- From the analysis above, we find that the values of Macrozoobenthos are not change too much from 1998 to 2013, but in 2014 it suddenly increased to 36 in Kannika and 37 in Sakda. Meanwhile, the value of Methylosmoline in Kohsoom and Somchair increased sharply, from below 10 to more than 50, which only took place during a year.
- For all the chemicals exist in Boonsong Lekagul, some have declined but more new chemicals detected, so in this way it would affect our result to judge the situation of the environment.
- From the picture we can see how the number of measures changed over years, and the color indicate the value of the measures. We can see that the chemical average value became much higher than usual in 2003. From the second graph, we can see the water temperature is in a slowly increasing trend, and the trend in each location is almost same with others.
Question 2
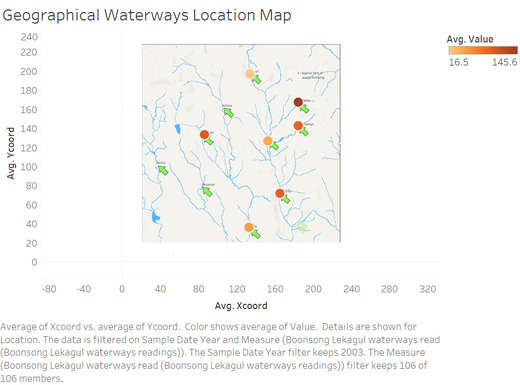
- From our analysis above, we find that in year 2003, the chemical value was quite high than usual, but the count of recording is not much, so this may lead to the high average value, and when we see from the waterway situation from the map, all the location had abnormal high values except Boonsri.
- The provided data are not continuous, many missing values may affect the result of the analysis. And the chemicals measures are quite messy, without sufficient data support, we could not reach the exact soil damage reasons.
Question 3
- The geographic data would be more accurate than the waterways map for analysis result.
- Current dataset only including water temperature, chemicals, more measures and variables should be included for better analysis result, such as tourist, traffic, human activity etc.


